Matrices
- A set of elements organized in rows and columns.
- Rows are the horizontal lines and columns are the vertical ones, both are usually zero-indexed.

- Matrix dimensions: (# of rows) x (# of columns)
- Matrix addition and subtraction

- Matrix multiplication
Mat A x Mat B
(2,3) x (3,2)
(Ai, Aj) x (Bi, Bj) Inner dimensions (Aj & Bi ) must be equal to be able to perform matrix multiplication with an output matrix with the size of the outer dimensions (Ai, Bj)

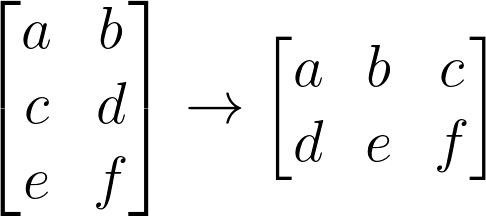
- Matrix Transpose
A (3x2) matrix transposed yields a (2x3) matrix

- Matrix Inverse
I is called the Identity matrix, It’s all zeroes with a diagonal of ones with the same dimensions of A.

Vectors
- A vector is n x 1 matrix
- Represents a straight line in n-dimensional space

- Vector Magnitude (Norm): Gives the length of a vector


- Unit Vector: Vector with norm = 1
- For an n-dimensional vector

- The norm of the vector squared is equivalent to

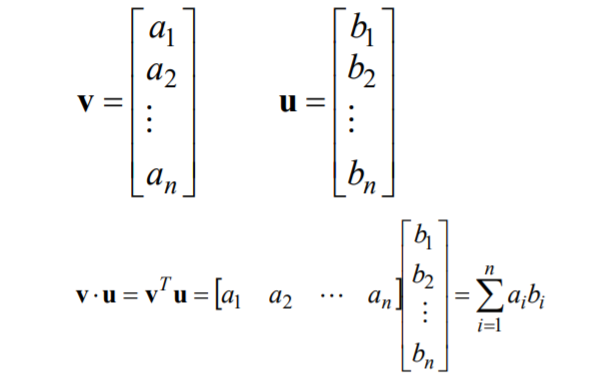
- Vectors Dot Product

- For an n-dimensional vector

- Dot product can be expressed as


- If v is a unit vector, then the dot product is equivalent to the projection of the vector u on the vector v
- If both vectors are unit vectors, the dot product will be maximum if both vectors are perfectly aligned
- If two vectors are orthogonal, the dot product will equal 0

Probability Theory
Probability theory is our way of dealing with uncertainty in the world, It’s the mathematical framework that estimates the probability of an event happening with respect to other possible events. Probability is at the very deep level of many machine learning algorithms.
Let’s discuss the most famous experience that explains probability theory. Tossing a fair coin twice
In this example, the sample space is the collection of all possible outcomes.
SS = {HH, TH, HT, TT} T is tails and H is heads. In most times you’ll be interested in an event which is a subset of all possible outcomes, for example, you might be interested in only one outcome which is heads on both tosses {HH} or interested in the fact that both tosses yield different faces {HT, TH}.
The probability of an event is a number assigned to an event Pr(X).
Pr(X) >= 0
Pr(SS) = 1 (remember SS is the sample space)
Frequentists Statistics:
Pr(X) = n(X)/N
— If we repeat experiment X N times. If n(X) is the number of times we observe X.Then Pr(X) = n(X)/N
Joint Probability
For 2 events X and Y, Joint Probability is the probability that X and Y happen at the same time, What’s the probability that the first toss is heads and the second toss is tails.
Pr(1st is H and 2nd is T) = Pr(1st is H) Pr(2nd is T) = 0.5 * 0.5 = 0.25.if X is {HH} and B is {HT, TH}, the joint probability P(XY) is 0 because it’s impossible that X and Y happen at the same time.
Pr(1st is H and 2nd is T) = Pr(1st is H) Pr(2nd is T) = 0.5 * 0.5 = 0.25.if X is {HH} and B is {HT, TH}, the joint probability P(XY) is 0 because it’s impossible that X and Y happen at the same time.
Independence
If 2 events X, Y are independent then

Meaning that X happening doesn’t say anything about the probability of y happening. In the example of the coin, if the 1st toss yielded H, this doesn’t mean anything regarding the 2nd toss it could be an H as well as a T, still a 50–50 chance.

In the above figure, It is the results of a high blood pressure test when applied to people who are younger than 30 years old and those who are older. The table shows the results of a sample.
If X is {Subject is less than 30 years old} and Y is {Subject does not suffer from high blood pressure}
If X is {Subject is less than 30 years old} and Y is {Subject does not suffer from high blood pressure}
Pr(XY) is 1800/4000,
Pr(X) is 2000/4000,
Pr(Y) is 2000/4000
Since Pr(XY) doesn’t equal Pr(X)PR(Y), this means that X and Y are dependent.
Pr(X) is 2000/4000,
Pr(Y) is 2000/4000
Since Pr(XY) doesn’t equal Pr(X)PR(Y), this means that X and Y are dependent.
Conditioning
if X and Y are events with Pr(X) > 0, the conditional probability of Y given X is

In simpler words, this means if we know that Y happened, what is the probability of X?

Again to this example in the figure above,
If X is {Subject is less than 30 years old} and Y is {Subject does not suffer from high blood pressure}
If X is {Subject is less than 30 years old} and Y is {Subject does not suffer from high blood pressure}
Pr(X|Y) = ?
What is the probability that the subject is less than 30 years old when we know that he/she doesn’t suffer from high blood pressure?
Pr(X|Y) = Pr(XY)/Pr(X) = (1800/4000)/(2000/4000) = 0.9
Pr(Y|X) = Pr(XY)/Pr(Y) = (1800/4000)/(2000/4000) = 0.9
Both being the same is just a coincidence, now if we have a result test that says that the subject doesn’t suffer from high blood pressure, we can estimate a percentage of 90% that the subject is younger 30 years old.
If we know that X and Y are independent then Pr(A|B) = Pr(A), remember the coin-tossing example, if we know that no output has a special effect on the other output then the probability of any output happening neither affects nor is affected by any prior conditions.
Bayes’ Rule
Given 2 events X and Y and suppose Pr(X) > 0 then


If we have 2 boxes, one of them is red and the other is blue, the blue box contains 3 planes and 1 star and the red box contains 6 stars and 2 planes.
Let the Pr(picking from the blue box) is 60% and Pr(picking from the red box) is 40%.
Let the Pr(picking from the blue box) is 60% and Pr(picking from the red box) is 40%.
Shape is S and Box is B
Pr(B = r) = 0.4
Pr(B = b) = 0.6
Pr(B = r) = 0.4
Pr(B = b) = 0.6
Conditional Probability:
Pr(S = p| B = r) = 1/4
Pr(S = h| B = r) = 3/4
Pr(S = p| B = b) = 3/4
Pr(S = h| B = b) = 1/4
Pr(S = p| B = r) = 1/4
Pr(S = h| B = r) = 3/4
Pr(S = p| B = b) = 3/4
Pr(S = h| B = b) = 1/4
Probability of picking a plane:
This can be interpreted as the probability of picking a plane from the blue box if we choose the blue box and the probability of picking a plane from the blue box if we choose it.
Pr(S = p) = Pr(S = p|B = r)p(B = r) + Pr(S = p| B = b)p(B = b) = 1/4 * 4/10 + 3/4 * 6/10 = 11/20
This can be interpreted as the probability of picking a plane from the blue box if we choose the blue box and the probability of picking a plane from the blue box if we choose it.
Pr(S = p) = Pr(S = p|B = r)p(B = r) + Pr(S = p| B = b)p(B = b) = 1/4 * 4/10 + 3/4 * 6/10 = 11/20
This is pretty much the basics that you need to be aware of to continue your journey in ML, Good luck!
You're following Towards Data Science.
You’ll see more from Towards Data Science across Medium and in your inbox.
WRITTEN BY


No comments:
Post a Comment