This writing portrays an innovation analysis of Greece. The model-based feature importance of multiple machine learning algorithms is utilized to determine the most important indicators affecting the fluctuation of the innovation output score of Greece. The classifiers used are Logistic Regression, Random Forest, Extra-Trees and Support Vector Machines. The data of this study is provided freely by the European Innovation Scoreboard.
Introduction
Innovation can be defined as a process that provides added value and a degree of novelty to the organization, suppliers, and customers, developing new procedures, solutions, products and services and new ways of marketing [1]. It is one of the most important concerns of each organization. Its role in the development and coordination of the market is intrinsic. The importance of innovative applications is crucial in all human areas from product development, methods of management, ways of doing works [2].
Background Information
Related Data
The European Commission provides various tools that map, monitor and assess the EU’s performance in different innovation areas. The information provided helps policy-makers and practitioners at the EU, national and regional levels to benchmark their performance and policies and to learn about new trends and emerging business opportunities that can inform evidence-based policy-making [3]. The European Innovation Scoreboard (EIS) is such a tool and provides a comparative assessment of research and innovation performance in Europe. It assesses the relative strengths and weaknesses of national research and innovation systems and helps countries and regions identify the areas they need to address.
The EIS version of 2018 discriminates between four main types of indicators and ten innovation dimensions, capturing in total 27 different indicators [4]. The four main categories including composite indicators are:
- Framework conditions: main drivers of innovation performance external to the firm and differentiates between three composite indicators (Human resources, Research systems, Innovation-friendly environment).
- Investments: investments made in both the public and business sectors and differentiates between two composite indicators (Finance and support, Firm investments).
- Innovation activities: different aspects of innovation in the business sector and differentiates between three composite indicators (Innovators, Linkages, Intellectual assets).
- Impacts: the effects of firms’ innovation activities and differentiates between two composite indicators (Employment impacts, Sales impacts).
The time-series data of EIS 2018 refer to time-frame 2010–2017.
Machine Learning
The feature selection is a fundamental technique in machine learning [5]. One can not keep or drop features at random. There are several feature selection methods including dimensionality reduction [6]. In general, there are two main categories of feature importance methods, the model-agnostic and the model-based. Model-agnostic feature selection techniques such as forward feature selection extract the most important features required for the optimal value of chosen key performance indicators. However, this approach has generally one drawback, the large time complexity. To circumvent that issue feature importance can directly be obtained from the model being trained. The method above is the model-based approach. Thus, the aforementioned method is utilized to estimate the importance of features.
Logistic Regression is a binary classification algorithm. It aims to find the best hyperplane in k-dimensional space that separates the two classes, minimizing logistic loss [7]. To estimate the importance of each feature to the model output, the k-dimensional weight vector is used. The large absolute value of the jth weight signifies the higher importance of the jth feature in the prediction of class.
Random Forest is a variation of the decision tree model. It is an ensemble model using multiple decision trees as base learners. The base learners are of high variance, low bias models. The variance of the overall model is reduced by aggregating the decisions taken by all base learners to predict the response variable. The idea is to ensure that each base learner learns a different aspect of data. This is achieved via both row and column sampling [8]. In a classification setting the aggregation is done by taking a majority vote. At each node of a decision tree, the feature to be used for splitting the dataset is decided based on information gain criterion or the more computationally inexpensive Gini impurity reduction. The feature that maximizes information gain (or reduction in Gini impurity) is selected as the splitting feature. By using Gini importance the feature importance is calculated as the decrease in node impurity weighted by the probability of reaching that node. The node probability can be calculated by the number of samples that reach the node, divided by the total number of samples. Thus, it can easily be understood that the higher the value is the more important the feature.
Extra-Trees stands for Extremely Randomized Trees. This classifier is an ensemble learning method fundamentally based on decision trees. Extra-Trees classifier randomizes certain decisions and subsets of data to minimize over-learning from the data and overfitting. Extra-Trees is like Random Forest. This algorithm builds and fits multiple trees and splits nodes using random subsets of features [9]. However, the two key differences between Random Forest and Extra-Trees Classifiers are the following :
- Extra-Trees does not bootstrap observations. This algorithm uses sampling without replacement.
- Extra-Trees nodes are split on random splits of a random subset of the features selected at every node, not the best splits.
From a statistical point of view, dropping the bootstrapping idea leads to an advantage in terms of bias, whereas the split-point randomization has often an excellent variance reduction effect. The feature importance is computed as described above in Random Forest using Gini impurity.
The Support Vector Machine (SVM) is a powerful supervised learning model for prediction and classification. The fundamental idea of SVM is to map the training data into higher dimensional space using a nonlinear mapping function and then perform “linear” regression in higher dimensional space to separate the data. A predetermined kernel function is used for data mapping. Data separation is done by finding the optimal hyperplane. This optimal hyperplane is called the Support Vector with the maximum margin from the separated classes [10].
SVMs have numerous advantages over classical classification approaches like artificial neural networks, decision trees, and others. Good performance in high dimensional spaces can be considered as an advantage. Moreover, the Support Vectors depend on a little subset of the training data which gives SVM an awesome computational advantage.
For this research, the SVM algorithm with the linear kernel is utilized. Thus to estimate the importance of each feature to the model output the k-dimensional weight vector is used. The large absolute value of the jth weight signifies the higher importance of the jth feature in the prediction of class. The absolute size of the weight coefficients to each other can then be used to determine feature importance from data.
Data Collection & Preprocessing
Data from the European Innovation Scoreboard (EIS) database version 2018 is used, comprising Greece for the period 2010–2017. The data is collected from the European Innovation Scoreboard website free of charge. The data is of high quality with minor missing observations for Greece.
The database is filtered to select only indicators regarding Greece. The data is cleaned of missing values. Also, the two indicators, whose values are missing for Greece level, are dropped from the analysis. These indicators are “Foreign doctorate students as a % of all doctorate students” and “Employment in fast-growing enterprises (% of total employment)”. For each indicator, time-series data are constructed from 2010 to 2017 using the normalized scores provided by the database. In total the time series data are comprising of 25 indicators and the summary innovation index.
The names of indicators are truncated for readability purposes. The full names of indicators are listed below:
- Broadband_penetration: Broadband penetration.
- Venture_capital: Venture capital (% of GDP).
- Design_applications: Design applications per billion GDP (in PPS).
- Trademark_apps: Trademark applications per billion GDP (in PPS).
- Employment_activities: Employment in knowledge-intensive activities (% of total employment).
- Enterprises_training: Enterprises providing training to develop or upgrade the ICT skills of their personnel.
- Innovative_Smes: Innovative SMEs collaborating with others (% of SMEs).
- International_publications: International scientific co-publications per million population.
- Knowledge_exports: Knowledge-intensive services exports as % of total services exports.
- New_doctorate_grads: New doctorate graduates per 1000 population aged 25–34.
- Non_rd: Non-R&D innovation expenditures (% of turnover).
- Opportunity_enterpre: Opportunity-driven entrepreneurship (Motivational index).
- Pct_patent: PCT patent applications per billion GDP (in PPS).
- Percentage_tertiary_edu: Percentage population aged 25–34 having completed tertiary education.
- Percentage_lifelong_learning: Percentage population aged 25–64 involved in lifelong learning.
- Private_co_funding: Private co-funding of public R&D expenditures (percentage of GDP).
- Public_private_pubs: Public-private co-publications per million population.
- Rd_business: R&D expenditure in the business sector (% of GDP).
- Rd_public: R&D expenditure in the public sector (% of GDP).
- Sales: Sales of new-to-market and new-to-firm innovations as % of turnover.
- Scientific_pubs: Scientific publications among the top 10% most cited publications worldwide as % of total scientific publications of the country.
- Smes_in_house: SMEs innovating in-house as % of SMEs.
- Smes_marketing: SMEs introducing marketing or organizational innovations as % of SMEs.
Modeling & Implementation
Firstly, correlation analysis is used to avoid including the highly correlated features in the analysis. Then, the modelling technique of the time series classification process is briefly described.
The figure below shows the correlation heatmap for Greece’s indicators. For visualization and interpretation purposes, heatmaps are used presenting the pairwise correlation analysis. To avoid multicollinearity issues, the threshold for dropping the highly correlated features is set 0.90. However, this threshold value is still considered a high value. It will be sure better to use a threshold value of 0.70, but the number of data features is limited. Thus, the features having 0.90 correlation are dropped from the analysis.


Therefore, the following indicators should be dropped:
- Trademark applications per billion GDP (in PPS),
- Employment in knowledge-intensive activities (% of total employment),
- International scientific co-publications per million population,
- Knowledge-intensive services exports as % of total services exports,
- Percentage population aged 25–64 involved in lifelong learning,
- R&D expenditure in the business sector (% of GDP),
- R&D expenditure in the public sector (% of GDP),
- Sales of new-to-market and new-to-firm innovations as % of turnover,
- Scientific publications among the top 10% most cited publications worldwide as % of total scientific publications of the country,
- SMEs innovating in-house as % of SMEs,
- SMEs introducing marketing or organizational innovations as % of SMEs,
- SMEs introducing product or process innovations as % of SMEs.
Following, the time series modelling technique for classification purposes is described. A vector v is constructed, which models the fluctuation of the summary innovation index over the time frame (2010–2017) with the following technique:
- A sliding window with a step equal to one year over starts from the beginning of the time frame and if the value of the summary innovation index in the present year is higher than the value from the previous year then v=1, else v=0. Thus, it is a binary classification problem with feature matrix X the indicators and label y the vector v.
Then, the four machine learning models, namely Logistic Regression, SVM (linear kernel), Random Forest Classifier and Extra-Trees Classifier, are trained using a 3-fold cross-validation method. The fact that the data instances are limited leads us to cross-validate training of models, specifically 3-fold cross-validation. The model’s estimate for feature importance in each of the 3 folds is kept. Then, the final value of importance is the average of these 3 folds for each model. Each model-based importance value is transformed in percentage for each model. Finally, the summary of feature importance is the average of all percentage values of indicator importance from each model.
Results
Following, there is a figure summarizing feature importance in percentage for Greece’s indicators.

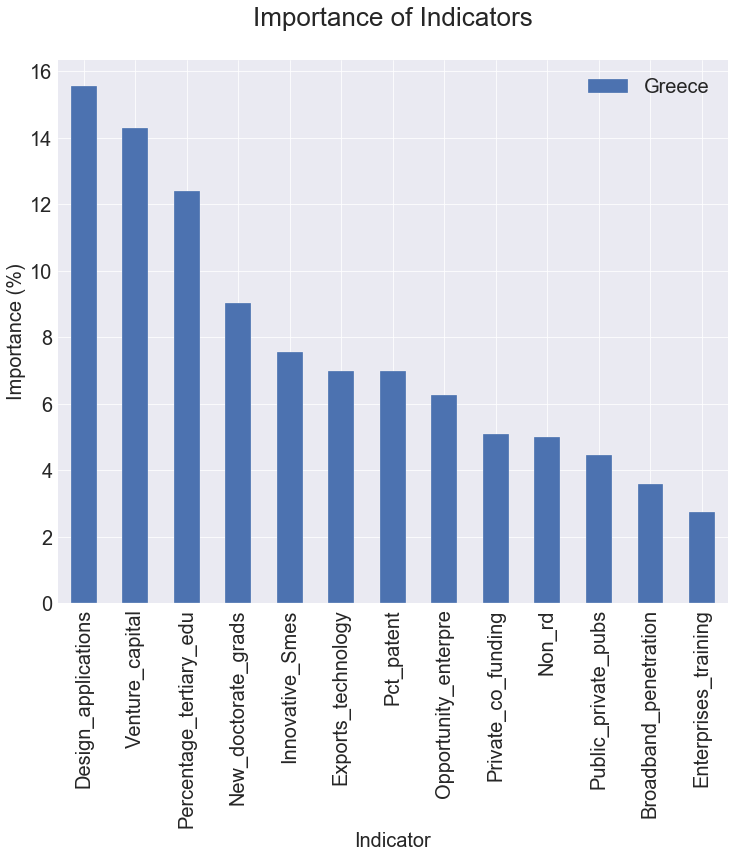
Undoubtedly, venture capital plays a significant role in the innovation output of Greece. Specifically, it is one of the most important concerns for start-ups and entrepreneurship. It paves the way for innovations and allows them to be engineered into marketable products. It aids the funding of business ideas that would otherwise not have a chance of gaining access to the necessary capital. Therefore, the development of creative technologies and services plays a key role in the country’s innovation output.
In addition, Greece also tends to rely heavily on well-educated people and creative SMEs to increase innovation production. New doctoral graduates and 25–34 tertiary graduates definitely play an important role in innovation production. Most of the innovative ideas come from educated people. In Greece, SMEs account for 99.9% of the country’s total private sector. Specifically, micro-enterprises account for about 96.6% of the private sector and about 56% of the total employment of the Greek economy. In these words, small and medium-sized businesses are the most important part of the Greek economy, directly affecting both the financial and social facets of economic life. Innovative small and medium-sized businesses partnering with other firms or organizations are an important indicator of Greek entrepreneurship. It seems that the transfer of expertise between public research organizations and companies, and between firms and other businesses, is important to the production of innovation.
Conclusion
In this writing, an analysis of the importance of innovation indicators using machine learning is presented. By employing a modelling technique on the summary innovation index of Greece, the effect of Greece’s indicators on its fluctuation is evaluated. A model-based feature importance analysis for Greece is implemented using four well-known classifier models. The results show that the top-five important features are Design applications, Venture Capital, Percentage population aged 25–34 having completed tertiary education, New doctorate graduates per 1000 population aged 25–34 and Innovative SMEs collaborating with others.
References
[1] R. Carnegie and Business Council of Australia., Managing the innovating enterprise: Australian companies competing with the world’s best. Business Library, 1993, p. 427, ISBN: 1863501517. [Online]. Available: https://catalogue.nla. gov.au/Record/1573090.
[2] H. Tohidi and M. M. Jabbari, “The important of Innovation and its Crucial Role in Growth, Survival and Success of Organizations”, Procedia Technology, vol. 1, pp. 535–538, Jan. 2012, ISSN: 2212–0173. DOI: 10.1016/J.PROTCY.2012.02.116. [Online]. Available: https://www.sciencedirect.com/science/article/pii/S221201731200117X
[3] Monitoring innovation | Internal Market, Industry, Entrepreneurship and SMEs. [Online]. Available: https://ec.europa.eu/growth/industry/innovation/ facts-figures_en.
[4] European Commission, DocsRoom — European Commission EIS 2018 Methodology Report, 2018. [Online]. Available: https://ec.europa.eu/docsroom/documents/30081.
[5] I. Guyon and A. Elisseeff, “An Introduction to Variable and Feature Selection”, Journal of Machine Learning Research, vol. 3, no. Mar, pp. 1157–1182, 2003, ISSN: ISSN 1533–7928. [Online]. Available: http://jmlr.csail.mit.edu/papers/v3/guyon03a.html.
[6] M. L. Bermingham, R. Pong-Wong, A. Spiliopoulou, C. Hayward, I. Rudan, H. Campbell, A. F. Wright, J. F. Wilson, F. Agakov, P. Navarro, and C. S. Haley, “Application of high-dimensional feature selection: evaluation for genomic prediction in man”, Scientific Reports, vol. 5, no. 1, p. 10 312, Sep. 2015, ISSN: 2045–2322. DOI: 10.1038/srep10312. [Online]. Available: https://www.nature.com/articles/srep10312.
[7] D. W. Hosmer and S. Lemeshow, Applied Logistic Regression. Hoboken, NJ, USA: John Wiley & Sons, Inc., Sep. 2000, ISBN: 9780471722144. DOI: 10.1002/ 0471722146. [Online]. Available: http://doi.wiley.com/10.1002/0471722146.
[8] T. K. Ho, “Random Decision Forests”, in Proceedings of the Third International Conference on Document Analysis and Recognition (Volume 1) — Volume 1, ser. ICDAR ’95, Washington, DC, USA: IEEE Computer Society, 1995, pp. 278–, ISBN: 0–8186–7128–9. [Online]. Available: https://dl.acm.org/citation.cfm?id=%20844379.844681.
[9] P. Geurts, D. Ernst, and L. Wehenkel, “Extremely randomized trees”, Mach Learn (2006. DOI: 10.1007/s10994–006–6226–1. [Online]. Available: http://citeseerx.ist.psu.edu/viewdoc/download?doi=10.1.1.65.7485&rep=rep1&type=pdf.
[10] V. Vapnik, “An overview of statistical learning theory”, IEEE Transactions on Neural Networks, vol. 10, no. 5, pp. 988–999, 1999, ISSN: 10459227. DOI: 10.1109/72.788640. [Online]. Available: https://ieeexplore.ieee.org/document/788640.
You're following Towards Data Science.
You’ll see more from Towards Data Science across Medium and in your inbox.

WRITTEN BY


No comments:
Post a Comment