I am confused with what I see in Firebase very often. What is the data behind?
Now I use Firebase Crashlytics and Performance data in Google Data Studio as it helps me to better understand my users.

If you want you can just copy the template. All sample datasets included. Let me know if you need them in BigQuery too and I will share it as a public dataset.


How to use Firebase Crashlytics data in Google Data Studio? How to calculate median login time using Firebase performance data?
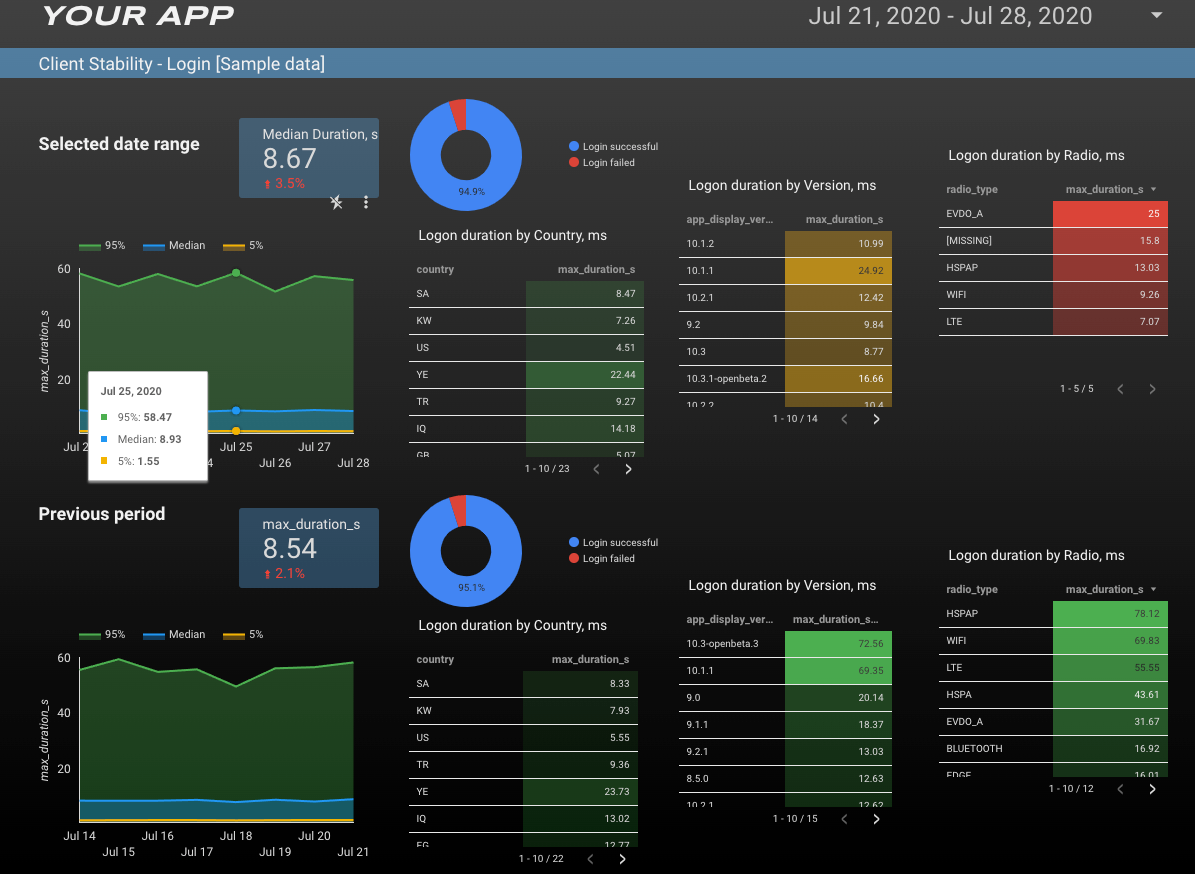
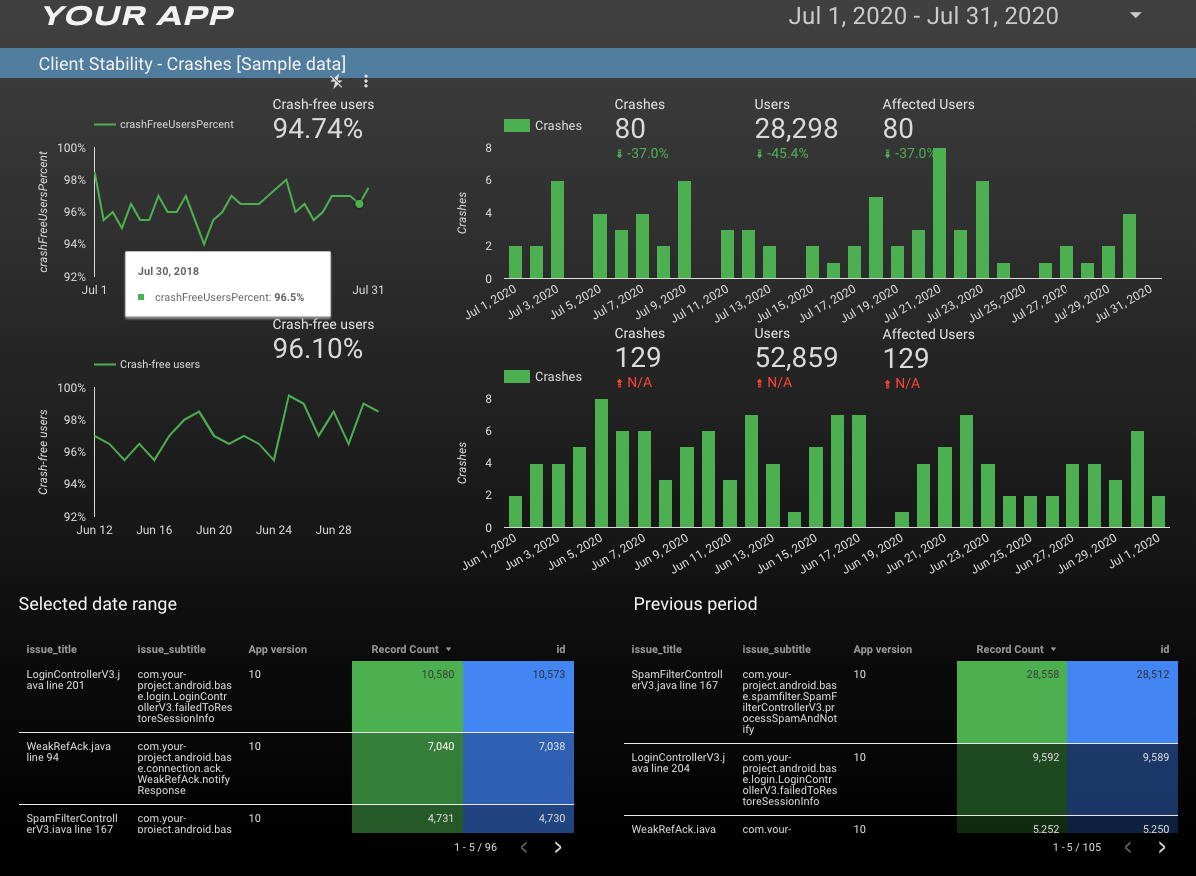
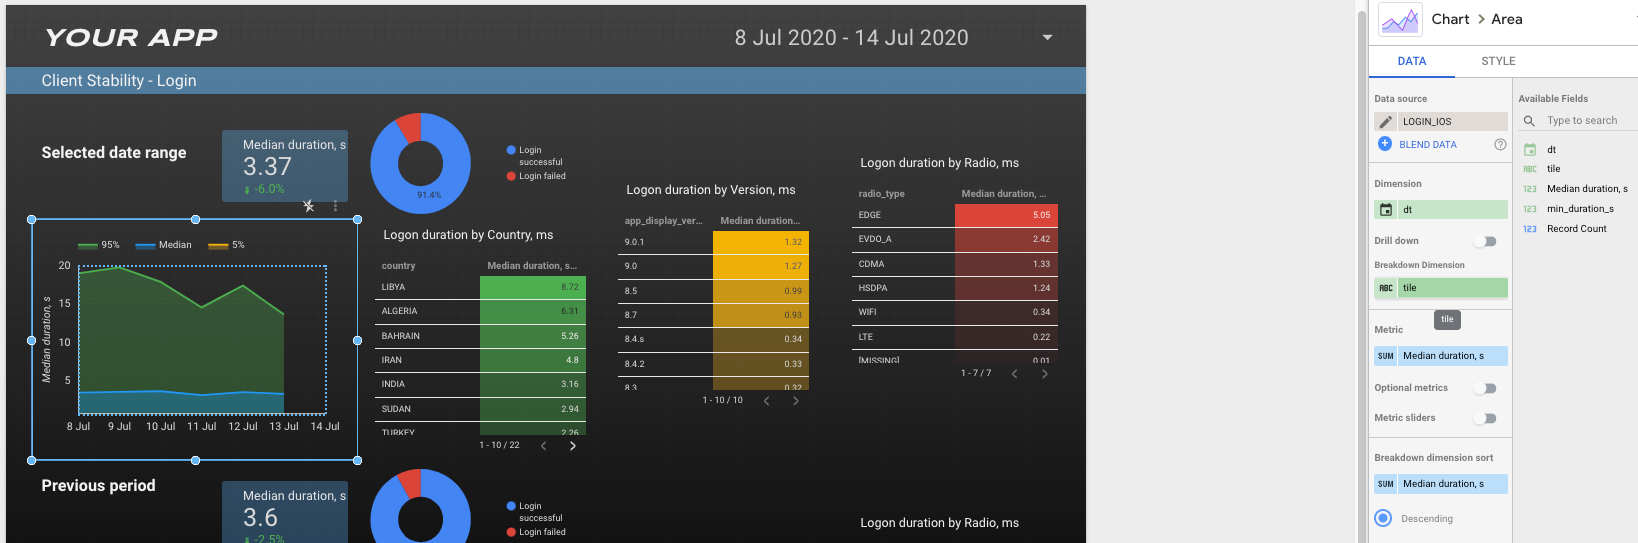
If you use Firebase to track performance and crashes in your iOS or Android client builds you might want to create a custom dashboard using this data. This post is about how to use Firebase Crashlytics and Performance datasets in BigQuery and Google Data Studio to build something like this:

You might want to display the following:
- Crashes
- Crash free users (count), selected timeframe vs previous timeframe.
- Crash events (count), selected timeframe vs previous timeframe.
- A list of top 3 crashes in the selected month (open and closed)
- A list of the top 3 crashes closed in the selected month (must still be closed)
Or your application performance data:
Login Stats, for example:
- Median login times; monthly average and a line graph to display time period versus last
- Median login time for month for top ten countries vs previous month; ordered by amount of users
- Median login time for month for top three app version vs previous month; ordered by amount of users
- Login Success/Fail percentage for month — pie chart.
First, I recommend to read this article. It explains how to connect to Firebase and extract data into BigQuery.
Firebase data extract
If you have already set up Firebase integration with BigQuery you should have the following datasets ready:

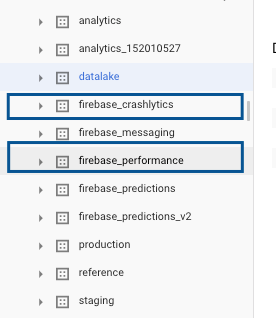
So now you can run queries on these tables.
These two we will use to create our custom report in Google Data Studio.
Google data studio template
I used standard Google Ads template from Google Data Studio. I think it looks nice and I slightly changed it for my needs.

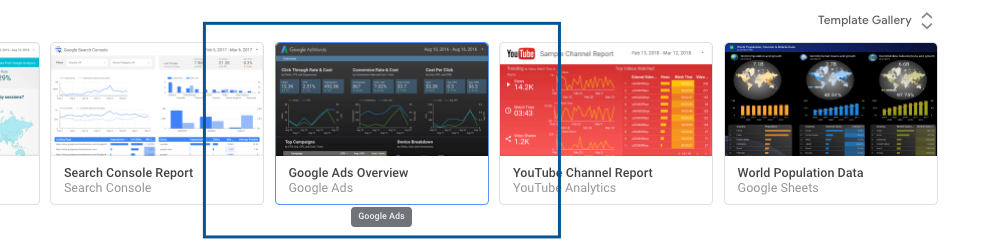
Download the report template
If you want to open the demo report and download the template I created:
- If you don’t have a Google account, you can create one.
- Click this link.
- Click use template.
Page 1
Let’s start building our dashboard.
Median logon duration

First two widgets use the same dataset and display median login times.
Example
Let’s say in our performance data we have the following logon duration records

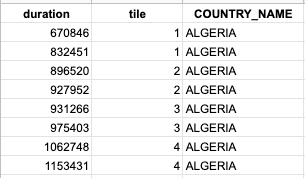
So the function NTILE(4) OVER (PARTITION BY COUNTRY_NAME ORDER BY duration) will split the data into 4 buckets based on row ordering and returns the 1-based bucket number that is assigned to each row. The number of rows in the buckets can differ by at most 1.
Similarily, if we use NTILE(100) it will split the data into 100 buckets. For example, 50 TILE first duration record will say that 50% of all logon’s durations were less than this first duration record in 50th TILE.
Read more in offcial Google docs here.
Let’s create a custom dataset to calculate MIN and MAX login times for TILEs we need using this knowledge.
Go to Google Data Studio and add new data source then select Custom query and insert the SQL from below. Don’t forget to enable date parameters.
If you replace @DS_END_DATE and @DS_START_DATE with actual dates and run the whole script in BigQuery it will give us the following:

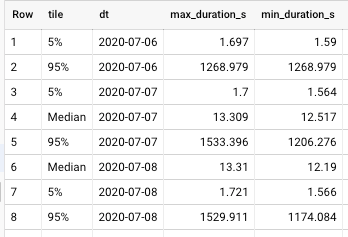
This is enough to create the widget using Area chart. Just add dt as dimension and tile as breakdown dimension as shown on Fig 1. Dataset configuration above.


Let’s create a dataset to display the same widget but for the previous period.
Example:


We will use the SQL from login_ios.sql and simply add some parameter transformation to get the previous date range based on selected report dates:
Just select `Range by data` in settings and it’s done:


Now let’s add Logon duration by Country, App version and Radio type.
I decided that adding separate datasets for each widget would be best because we already have tile breakdown and probably will need to use it as a filter.
I’m using logonCount to sort the resulting table widget by number of logons and filter down to Median interval only.


In a similar way add datasets login_ios_version.sql and login_ios_radio.sql and add them to widgets on the right.
For the widgets below add new datasets with modified date parameters like we did in login_ios_previous.sql


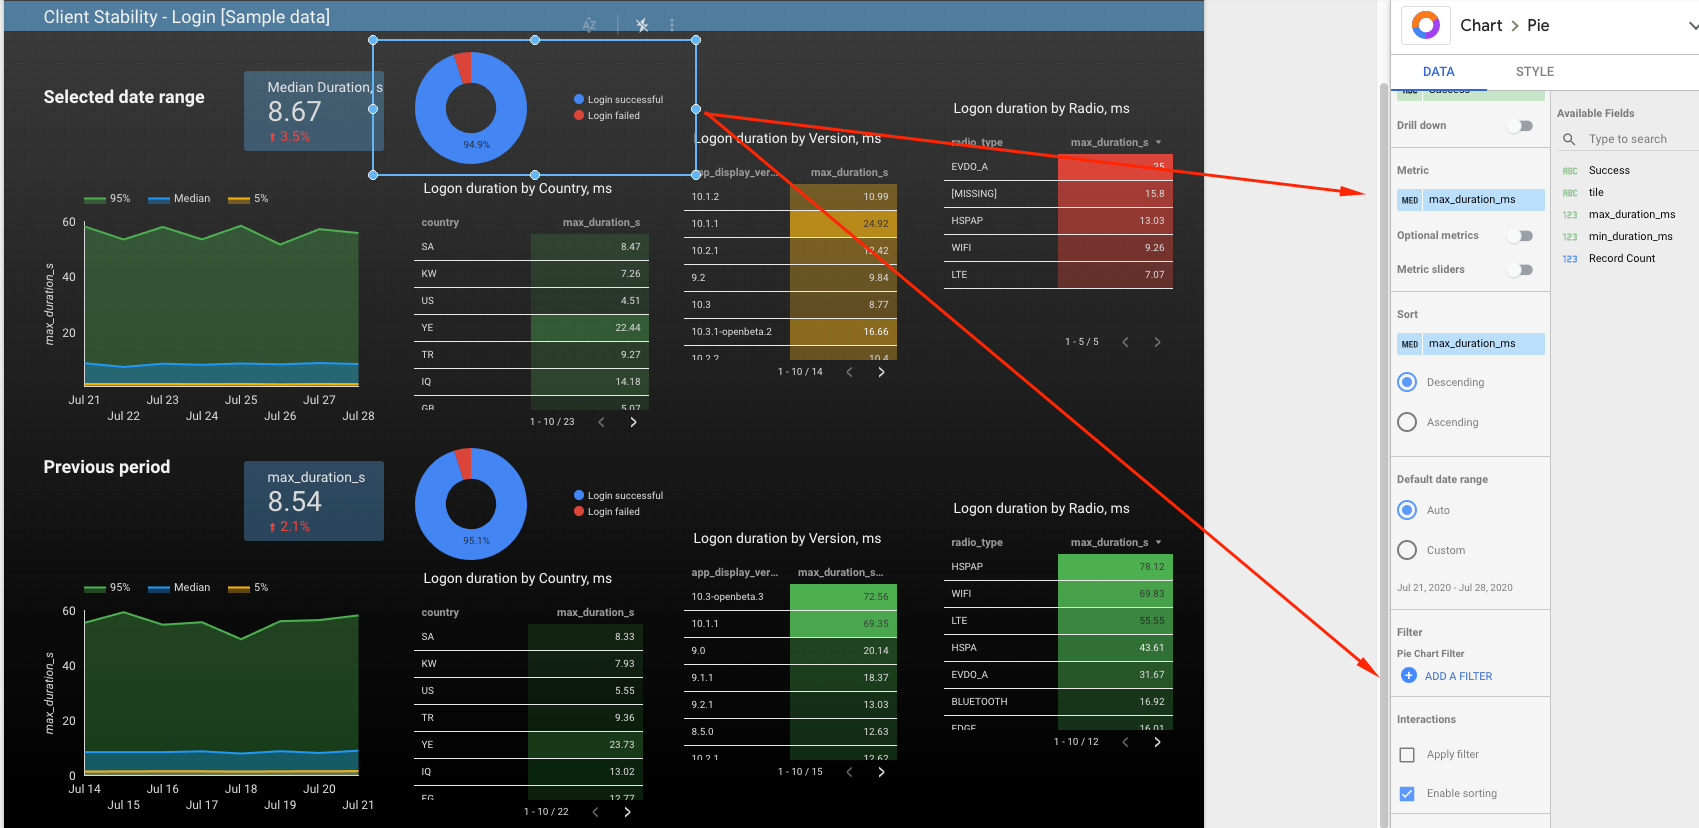
For the pie chart with percentage of successful logins create another custom dataset:

Done. You can add an extra page for your Android data. Just copy the datasets and replace the IOS performance table to ANDROID.
Page 2. Crashes.

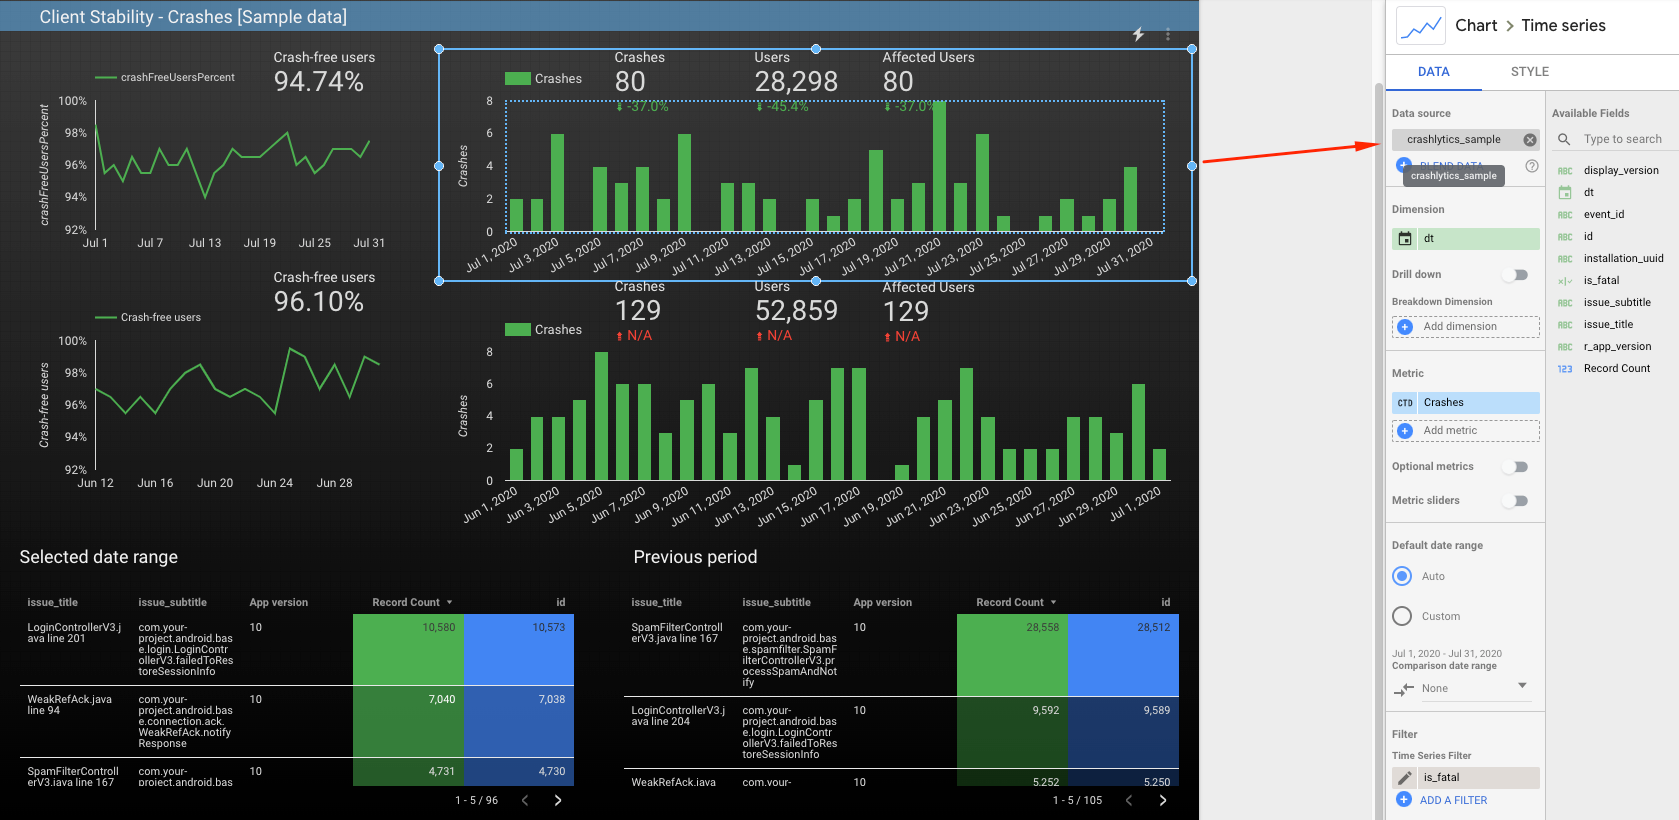
Let’s create a custom dataset crashlytics_ios.sql In google Data Studio we will count crash events where is_fatal flag equals true .
In a similar way create another dataset for the widget below but just for the previous period using previous_start_dt and previous_end_dt from pd.
This table widget is using the same dataset crashlytics_ios.sql just displaying a count of events and users by issue:


Crash-free users
Let’s create a custom dataset to display the percent of Crash-free users.
For this we will use firebase analytics dataset as suggested in Example 7 of Goggle documentation.

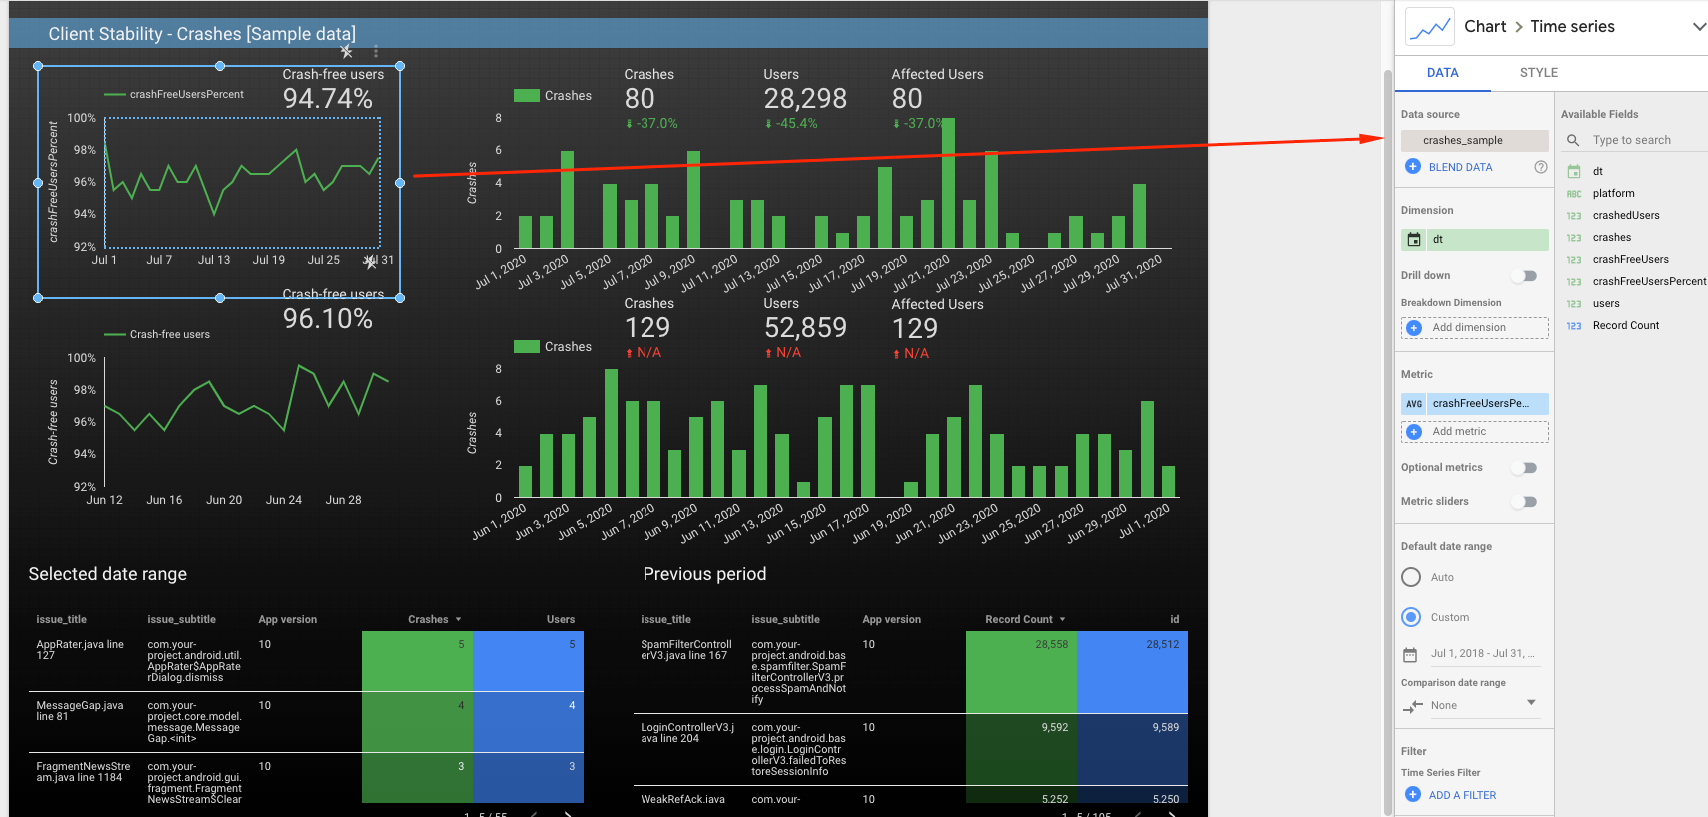
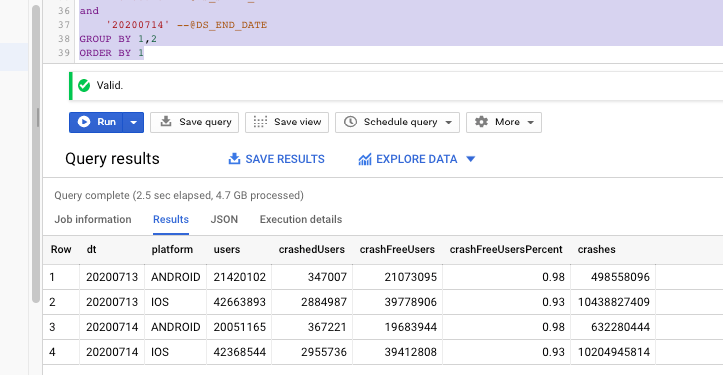
Let’s create the datset called crashes :
If you run it in BigQuery the results will be like that:

Replace the dates with parameter handlers and create a custom dataset in Google Data Studio.
Page 2 is done!
Thanks for reading!
Keep in mind that real client applications can generate a lot of data! Make sure to use partitioning in your scripts to reduce BigQuery cost and follow Google best practices from this article.
Let me know if you have any questions.
Recommended read:
Sample Firebase queries from Google: https://firebase.google.com/docs/crashlytics/bigquery-export


No comments:
Post a Comment