In this article, I would like to showcase what might be my simplest data science project ever.
I have spent hours training a much more complex models in the past, and struggled to find the right parameters to create machine learning pipelines.
Despite its simplicity, if I could only display one project on my resume, it would be this one.
Let me explain why.
Does the package determine the value of the gift?
As a child, I would always get excited about holidays because I could get gifts. (Just humour me here, I do have a point, I promise). My aunt presented me with this beautiful dress, perhaps more beautiful than any other gift I received that day.
Here’s the thing though — I didn’t even want to open it. She had shabbily wrapped it with newspaper, and the gift seemed to have lost half its value before I even saw what was inside.
To answer the question above, no. The package by no means determines the value of the gift.
However, it can greatly influence your expectation of what’s inside and can change the way you perceive it.
The machine learning models you spend weeks training are great. Demonstrate that. Don’t let them die in your Jupyter Notebook.
Recruiters have hundreds of resumes to read. It is almost impossible for them to read through all your code on GitHub and understand all your projects.
To stand out, you need to do something slightly different. Create an interface they can interact with. Maybe a live dashboard they can play around with.
Even if it's not the best dashboard or interface out there, it will create interest, because you created something they can actually use.
I wanted to do exactly that, which is why I came up with this portfolio project. In the next few sections, I will explain exactly what I did without going too much into the technical detail.
Aim
I aimed to display skills in the following areas:
- Data Collection
- Data Wrangling
- Data Visualization
- Machine Learning
- Web Development
In order to do so, I created the following components in my project:
- Front-end interface
- Movie Dashboard
- Movie Recommender System
I will explain and demonstrate each component in detail.
Note: If you don’t want to read through the entire article and just want to take a look at the final product, just scroll down and take a look at the ‘Links’ section.
Front-End Interface
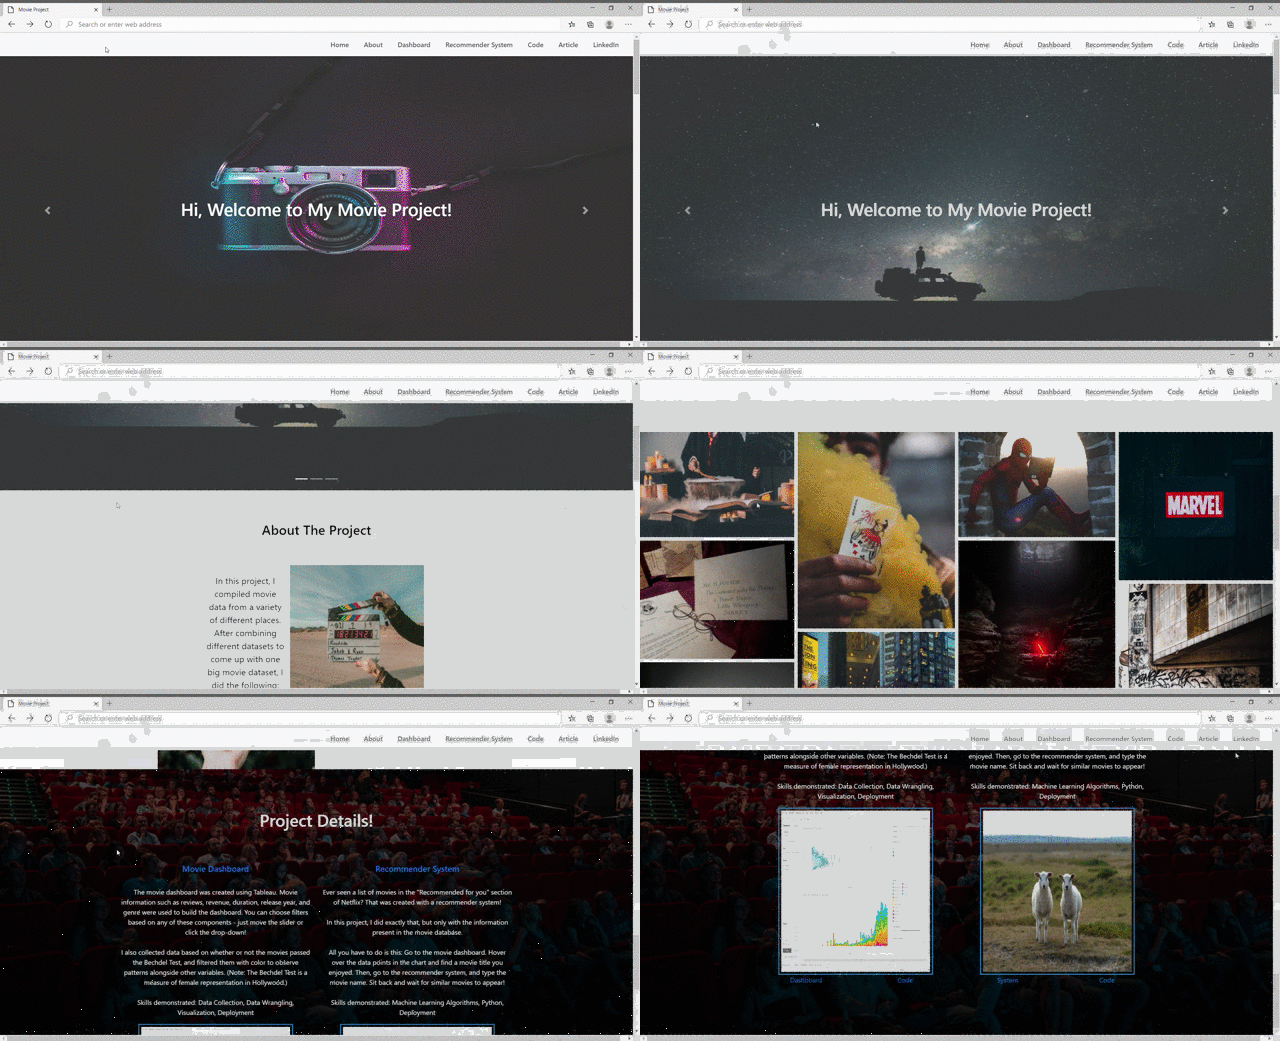
In the past, I would create projects and let the code sit in my GitHub repository. I write an occasional article explaining the project on Medium.
Here, I took a different approach.
I created a web-page and explained the different components in my project. I wrote briefly about how users can interact with the systems I created, and put up links to my code and Medium article.
The entire project can be understood and accessed through just one page, which makes it so much easier for people to engage with.
You can check the site out here — View on laptop or PC for better UI experience.
Movie Dashboard

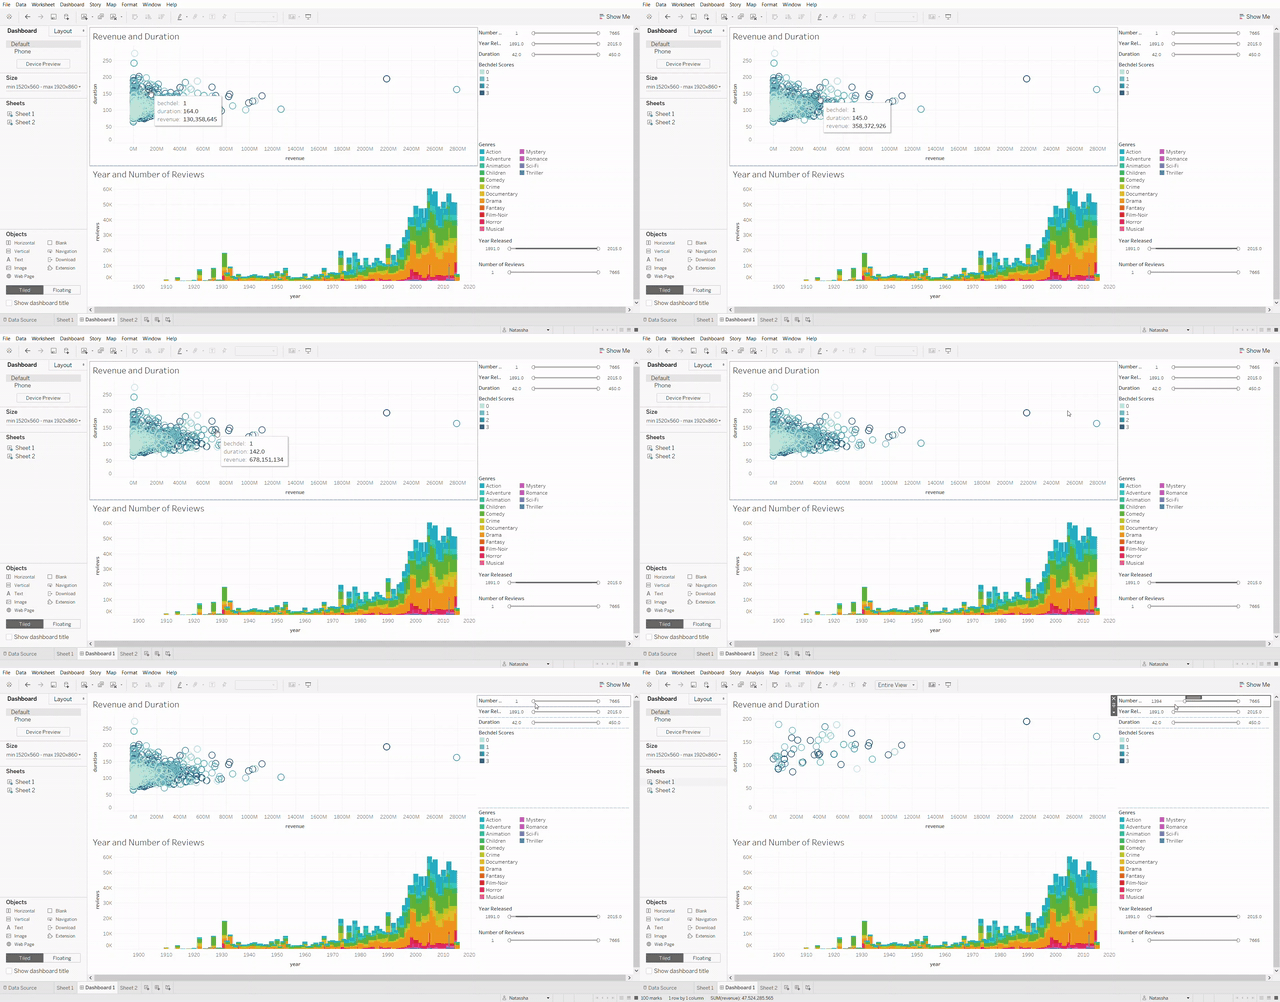
Next, I created a movie dashboard with Tableau.
The steps involved:
Data Collection
I had to collect data from a variety of different places. I also wanted to visualize Bechdel scores of these movies (a measure of female representation in Hollywood), so I used an API to get that data.
Data Wrangling
I cleaned the data and merged the datasets together. Once I was done, I could finally visualize it!
Data Visualization
Surprisingly, this took up a huge portion of my time compared to other parts of this project.
I spent two days trying to create a visually appealing dashboard.
I created one with a Python Dash app. I wasn’t too satisfied with the layout, and tried creating a Shiny web app in R instead.
It turned out better than my Dash app, and I loved the functionality. However, I simply didn’t find the design appealing.
Finally, I decided to use Tableau. This only took me about an hour to create. If you want to get started with Tableau, you can read this tutorial I created.
You can view my dashboard here — View on laptop or PC for better UI experience.
Recommender System
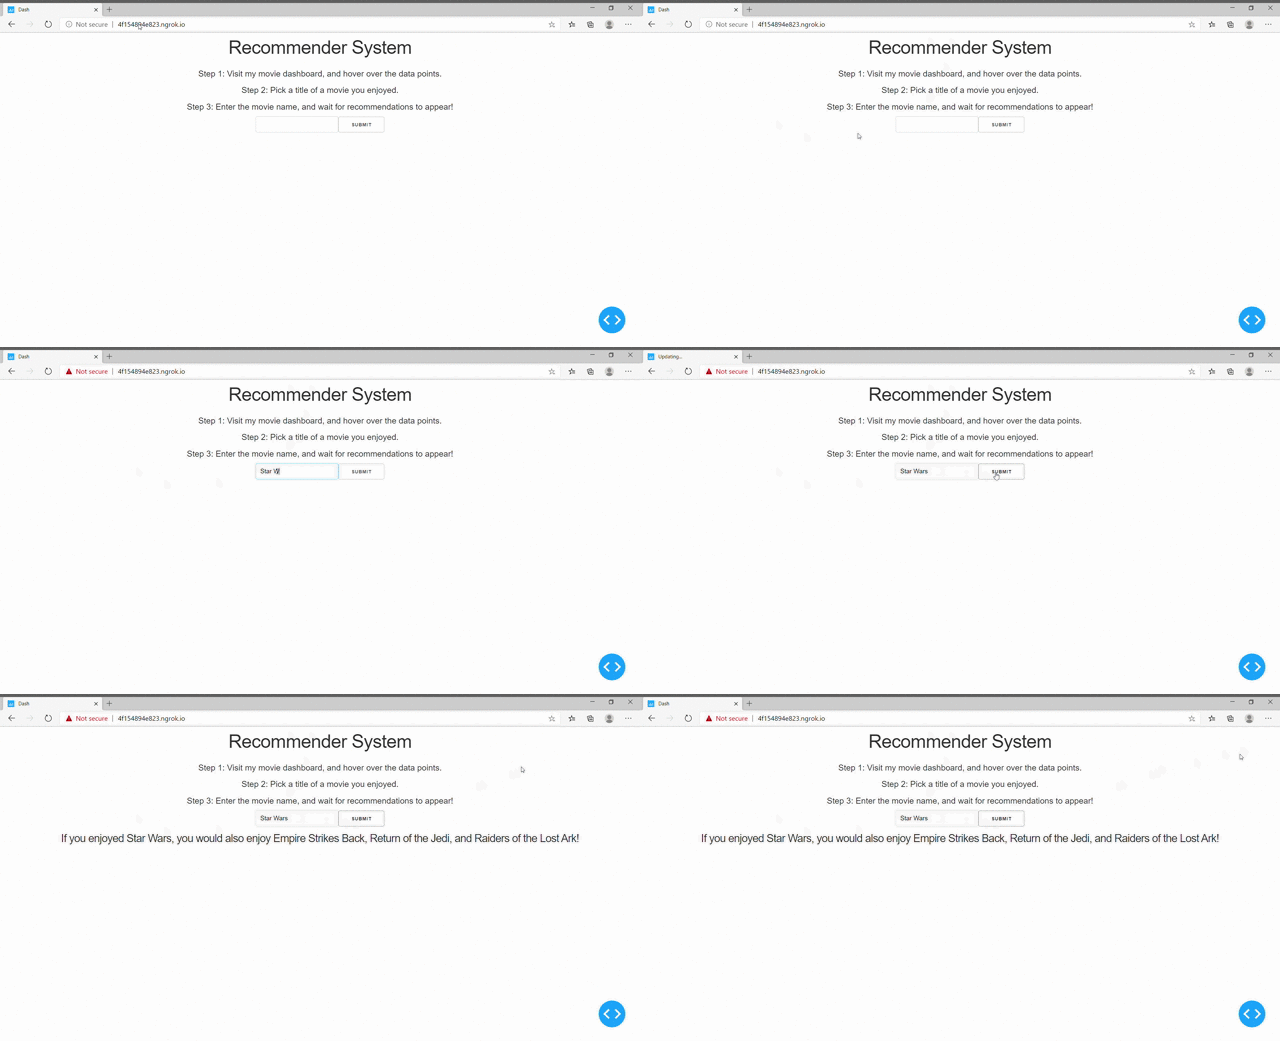
Finally, machine learning!
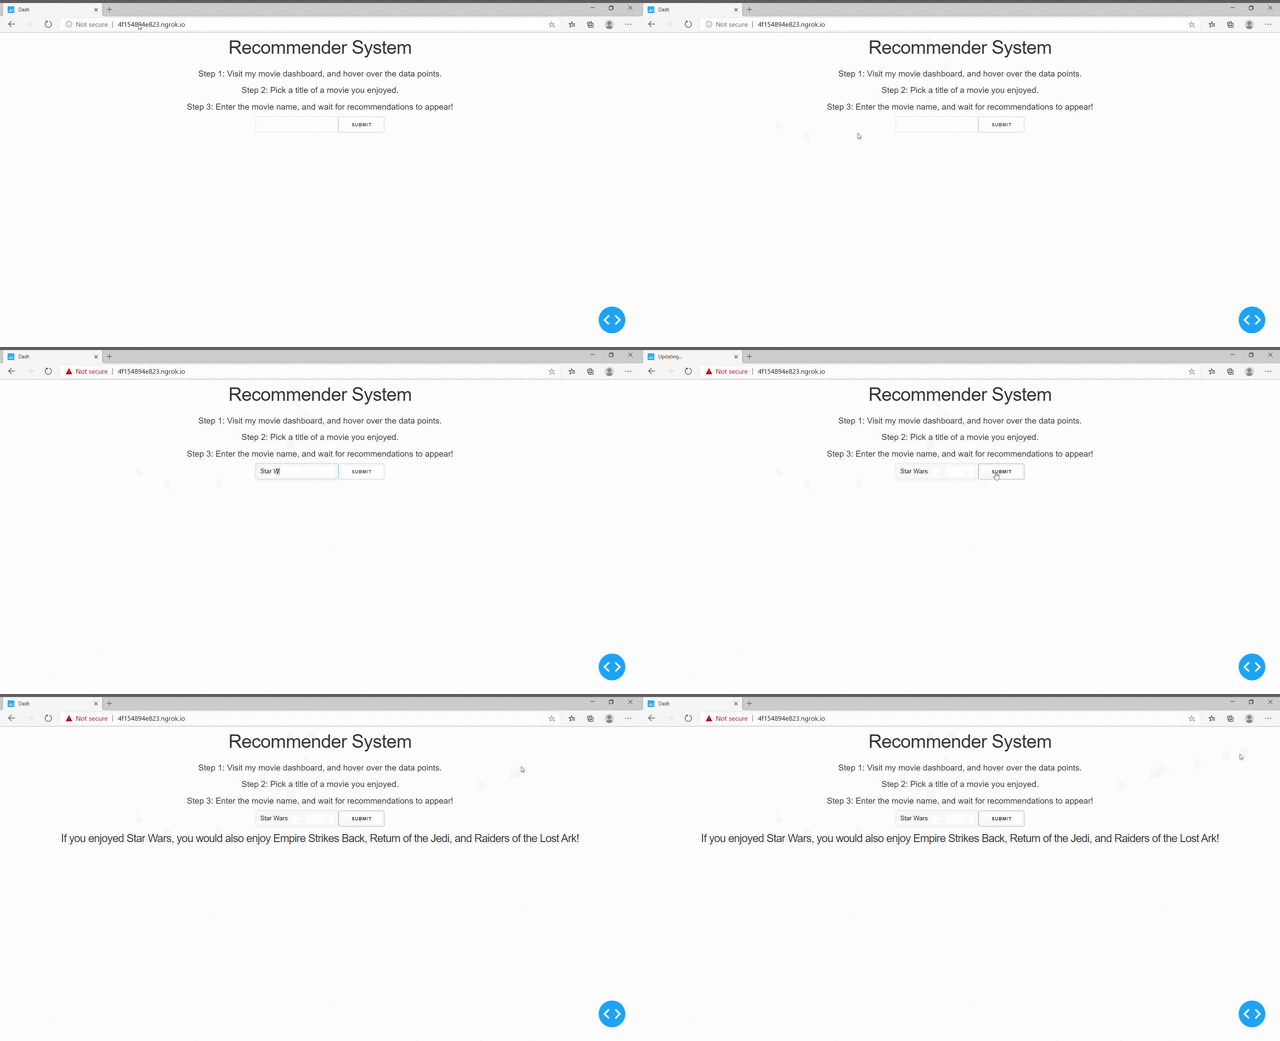
I created a simple recommendation system with the same data I used for the dashboard and deployed it with a Dash app.
Just enter a movie name, and it uses the back-end recommendation system to generate movie suggestions for you.
Actually, this recommendation system was created when I was just starting to learn machine learning.
I found the code in my Jupyter Notebook, and decided to clean it up a bit to create this simple application.
You can take a look at the recommendation system here — View on laptop or PC for better UI experience.
That’s it!
Links
- Front-End Interface
- Movie Dashboard
- Recommender System
- Code (I apologize since the codes are pretty messy, I will clean them and re-upload soon.)
I hope you enjoyed this article and found the tips above helpful. Jupyter Notebooks are great, but don’t let your projects just sit there.
Use your creativity to create something other people can interact with.
I’ve seen some incredible projects on GitHub with only one star. On the other hand, I’ve also seen some really simple projects gain a lot of attention just because of how it was presented.
Most importantly though, create projects you like to work on and do what you feel is enjoyable!
No comments:
Post a Comment