“Visualizing information can give us a very quick solution to problems. We can get clarity or the answer to a simple problem very quickly.” — David McCandless
Visualizing data is one of the essential steps in any data science project. It makes it easier to find patterns, detect anomalies, and communicate your results efficiently.
The process of visualizing data, however, can be a bit tricky. Today, there are so many plotting tools and libraries that we can use to bring our data to life through charts and colors. Some tools are quite extravagant and expensive.
So, how can one decide what to use?
Well, this article will — hopefully — help you answer that question.
In this article, we will cover the top 10 plotting libraries in Python; we will go through some usage examples and how to choose one of them for your next visualization adventure.
But,
Before we get into that, let’s first talk about the two types of plots we can generate.
Static vs. dynamic plotting
When plotting any information, we have options to choose from; we can either generate a static plot or a dynamic one.
Static plotting
Static plots contain graphs displaying constant relations between two or more variables. That is, once the plot is created, it can’t be changed by the user. In static plots, the users can’t change any aspects of the plot.
Dynamic plotting
Dynamic plots — also known as interactive plots — are used when the developer/ designer wants the users to interact with the plot, changing some aspects of it and getting more familiar with the data used to create it.
How to choose?
Okay, so you have some data that you want to visualize, but you don’t know where to start. Let me help you out. Whenever I start a project and need to create some visualizations, I often ask myself 4 questions that lead me to the right choice.
Q1: What is my target platform/media?
The first thing you need to decide is which plot type do you need, static or dynamic? Usually, static plots are used in printouts, technical papers, or reports. In this case, you need to tell your audience something and not to interact with the plot itself.
However, if you’re using the plot in an online tutorial, in a class, or any web application, where the users can play around with the data to understand it better or to use it elsewhere, then you should create a dynamic plot.
Q2: Is my data publically available?
This is a crucial thing to consider. If your data is private and is not publically available, then you need to use static plots. But, if the data is stored on public service that doesn’t require special permission to access, then a dynamic plot may be a better option.
Q3: What is my priority?
Once I have made my decision to use static vs. dynamic plotting. I ask myself, what is the priority of my visualization? Do I need it to be complicated with many layers? Answering this question helps choose the correct library to use.
Q4: Do I need a special kind of visualization?
Finally, I ask myself what kind of plotting do I need? Is it a simple chart? Bar, column, pie, or donut? Or do I need to plot something more specialized such as a network or a map?
Suppose I need to visualize general information, then using any library that offers my desired chart type. However, if I need to create a map or a network, that will limit my options and help me make the decision faster.
Top 10 Python Plotting libraries
Python is one of the most used programming languages in data science and many other applications. However, due to its popularity, Python has so many data visualization libraries to choose from. The wide variety of options is both a good and a bad thing.
Having many options mean you can choose the library the matches your targets entirely, but it can be too confusing to new people joining the field and to experts deciding what to choose.
Here, I will go through the top 10 Python libraries out there, how and when to use them. I divide those libraries into two categories, libraries used to plot static charts, and those used for dynamic graphs.
Let’s get visualizing…
Static plotting libraries
Matplotlib
We can’t talk about data visualization in Python without mentioning the first and oldest Python visualization library of them all, Matplotlib. Matplotlib is an opensource library that was created back in 2003 with a syntax close to MATLAB. Since then, the library has gained a lot of love and support than continues to this day.
Many Python packages are built upon Matplotlib core. For example, Seaborn and Pandas act as wrappers around Matplotlib, allowing the user to create graphs with fewer lines of code.
When to use Matplotlib?
- If you’re familiar with MATLAB, using Matplotlib will look familiar and will make your transition easier.
- If most of your data is time-series, then using Matplotlib will make it a bit complicated to use and plot.
- Matplotlib is wey powerful in dealing with static 2D plots. However, it gets quite complicated if you want to plot 3D or interactive visualizations.
- Matplotlib is a very low-level library, which means that one needs to write more code to get the visualization working.
- Matplotlib was not designed for data exploration purposes, so if your main goal is to do that, you might be better off using another library.
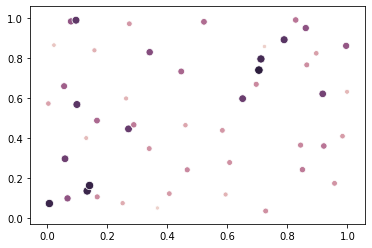
Usage Example


Seaborn
Seaborn is one of the libraries build upon Matplotlib. It acts as a wrapper to provide users with a high-level alternative to Matplotlib. You can create the same visualization as Matplotlib but with much fewer lines of code.
Since Seaborn is built upon Matplotlib, it contains the same charts type as Matplotlib in addition to some cool charts such as Heatmaps and Violin charts. Seaborn can also be used to give Matplotlib charts more visually appealing.
When to use Seaborn?
- I always recommend that if you’re using Matplolib, you should Seaborn with it to make your visualizations better.
- If you’re starting with Python and DS, Seaborn is an easy and straightforward library that you can use to create stunning charts with less to no effort.
- Seaborn offers easy customization methods to add your touch to your graphics. It gives you complete control over the color palette of the created graphs.
- Seaborn has many statistically-minded built-in plots that you can use easily, such as Facet plots and regression plots.
Usage Example

Plotnine
Back in 1993, a fantastic book was published. The Grammar of Graphics presented a layered rule guide for designers and data scientists to create beautiful, meaningful, and useful data visualizations.
If you used R before, Plotnine was built with similar syntax and as an implementation of the different aspects presented in the Grammar of Graphics book, and it’s based on the popular R library ggplot.
When to use Plotnine?
- The most straightforward reason to use Plotnine is if you’re transitioning from R to Python and want to create visualization without much hassle.
- Plotnine allows the user to easily compose plots by explicitly mapping data to the visual objects forming the plot.
- Plotnine API allows you to create different types of charts easily and with few lines of code without the need to go back to the documentation often.
- Plotting with Plotnine is powerful as it makes custom plots easy to think about and create.
Usage Example


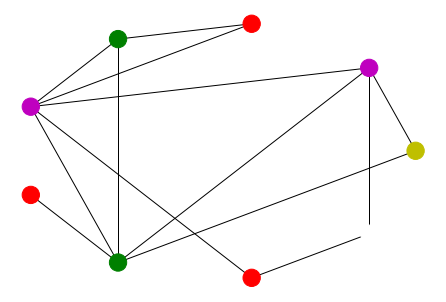
NetworkX
NetworkX is a Python library that is not solely for visualization. It is instead a package created to analyze, manipulate, and study the structure of complex networks.
NetworkX is one of those libraries that are field-specific or area-specific; that is, you can’t generate any charts using this library. For example, you can’t create a bar or pie chart using NetworkX.
When to use NetworkX?
- If you’re dealing with graphs or graph theory algorithms, using NetworkX will allow you to implement and analyze these applications quickly.
- If you’re trying to study the relationship between different data points.
- If you’re trying to simulate and analyze the performance of entire networks.
Usage Example

Missingno
Whenever you start a new data science project, you will need to perform some data exploration to understand your data better. One very annoying thing that often happens is coming across missing data entries. As a data scientist, missing data entries is one of the most challenging tasks in the entire project.
Well, Missingno is here to the rescue. It allows the user to test the dataset for missing entry by providing a visual summary of the dataset. So, instead of going through rows and rows of numbers, you can filter and sort the data based on completion and correlation between variables.
When to use Missingno?
- If you want to speed and ease up your data exploration phase of any project.
- Displays a count of values present per column, Matrix, Heatmap, and Dendrogram.
Usage Example
Dataset used is here.


Dynamic plotting libraries
Plotly
Plotly is a Javascript-based module to generate and manipulate interactive visualizations. With Plotly, you can create unique charts like dendrograms, 3D charts, and contour plots. Most of these charts types you cannot generate through most of the other libraries.
Moreover, Plotly has many built-in applications for machine learning and data science, which makes it easier to implement and visualize standard algorithms such as ML regression and kNN classifications.
When to use Plotly?
- If you want to start with creating interactive data visualizations in Python, then Plotly is the way to go. It allows you to create custom charts without any hassle.
- You can create stunning animations in Plotly that helps you communicate your data better.
- If you want to create beautiful maps, scientific graphs, 3D charts, or financial ones.
- Plotly allows you to create custom controls to your charts to give more interactive functionalities.
Usage Example

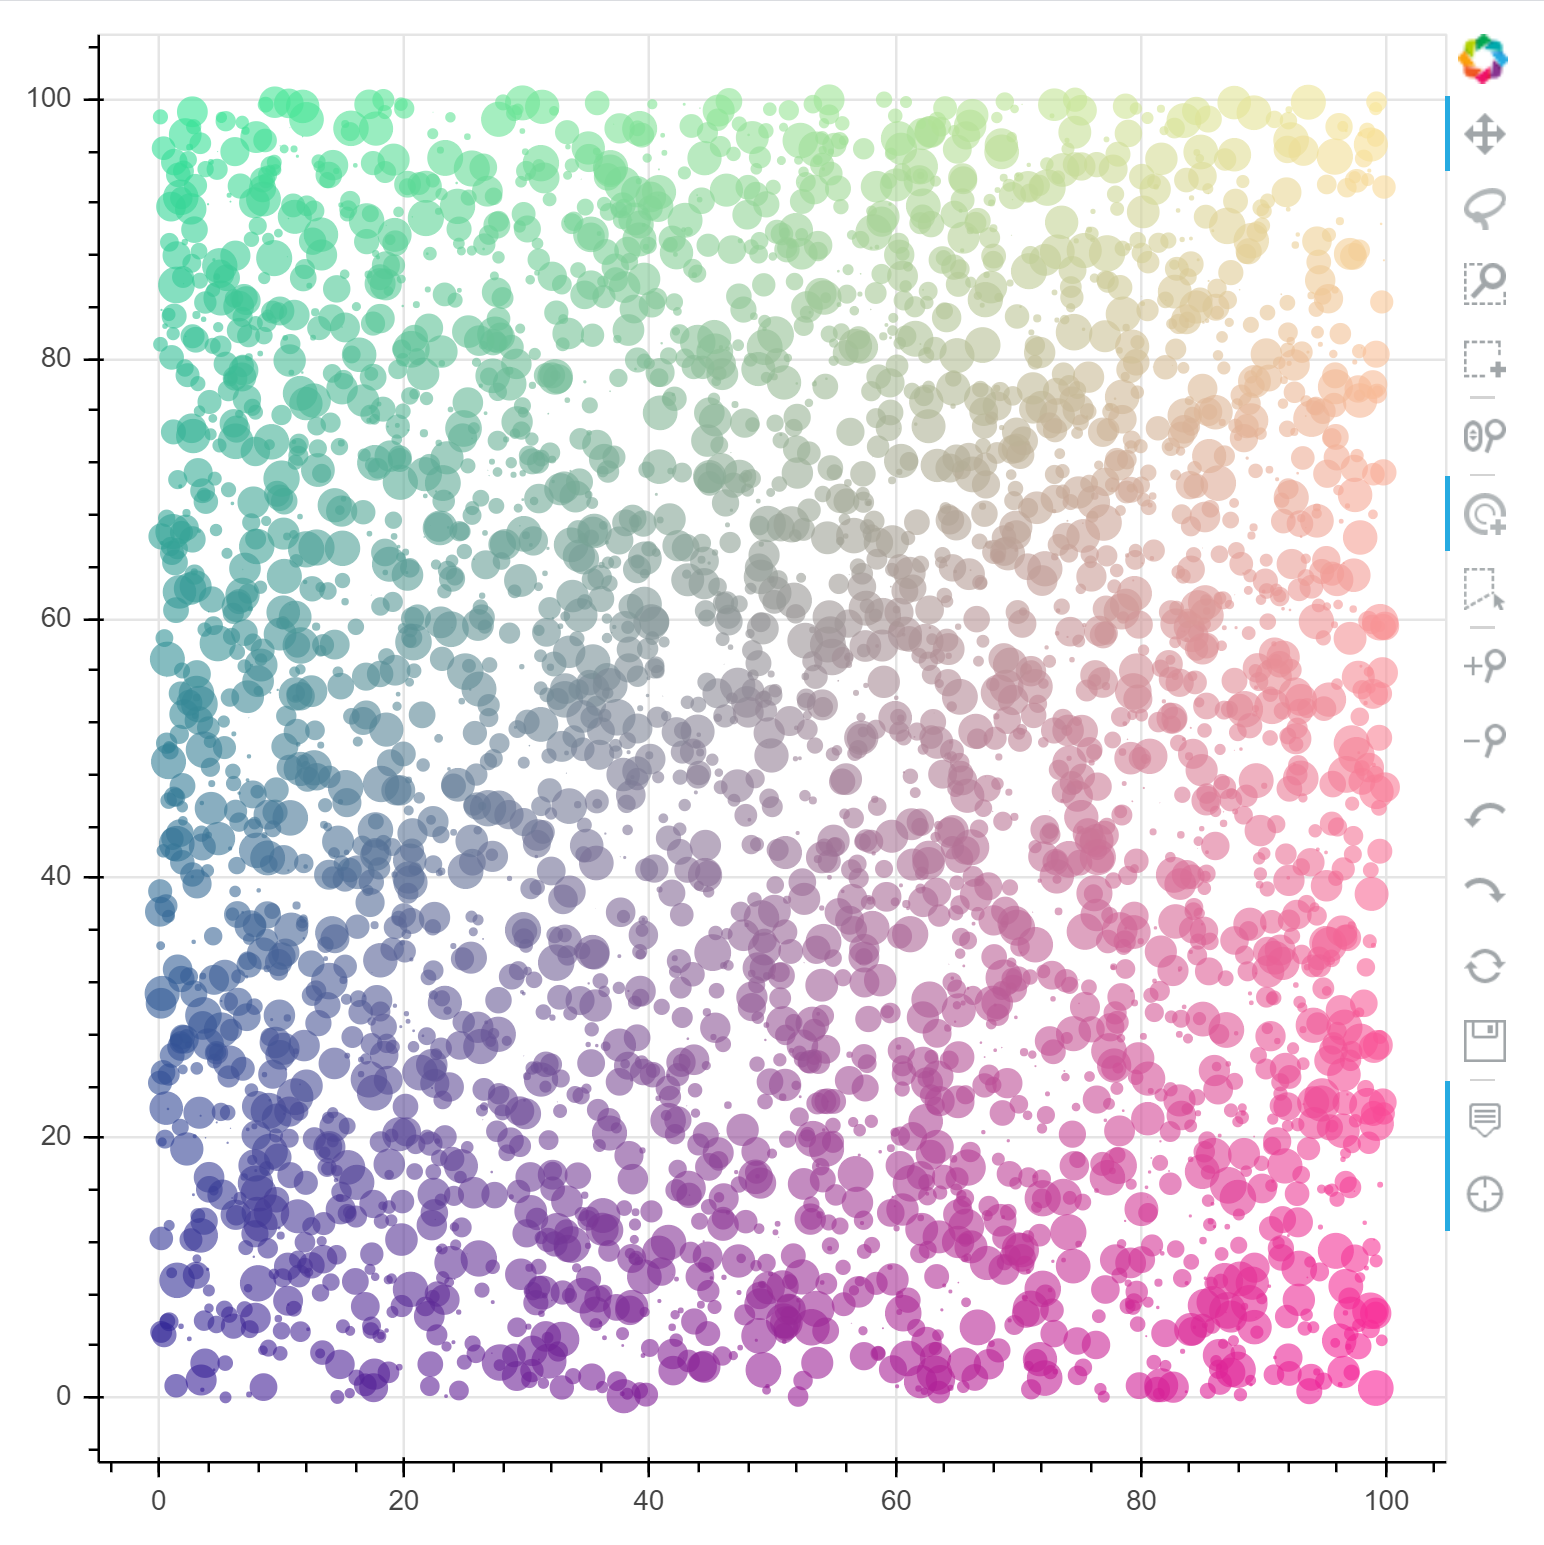
Bokeh
Similar to Plotly, Bokeh is a Javascript-based package that allows you to create stunning interactive visualizations. Besides, similar to Plotnine, Bokeh is an implementation of the rules presented in the Grammar of Graphics.
Bokeh provides three levels of control to accommodate different user types. The highest level allows you to create standard charts, such as bar, pie, scatter, and so on. The middle level offers some level of specificity as Matplotlib and allows you to control the basic building blocks of each chart. Finally, the lowest level gives you full control of every element of the chart.
When to use Bokeh?
- Create nice interactive visualizations.
- If you want to perform data transformations, such as adding jitter to crowded plots.
- If you want to create beautiful 2D graphics. However, if you want 3D graphics, go with Plotly.
Usage Example

Gleam
Gleam is a Python library that is inspired by the R Shiny library. It is built to allow Python developers to create interactive data visualization for the web.
Gleam puts it all together and creates a web interface that lets anyone play with your data in real-time, making it easier than ever to help others understand and interpret your data.
When to use Gleam?
- If you want to create visualizations for the web and don’t want to deal with JS, HTML, or CSS.
- If you want to give your users real-time control over your data.
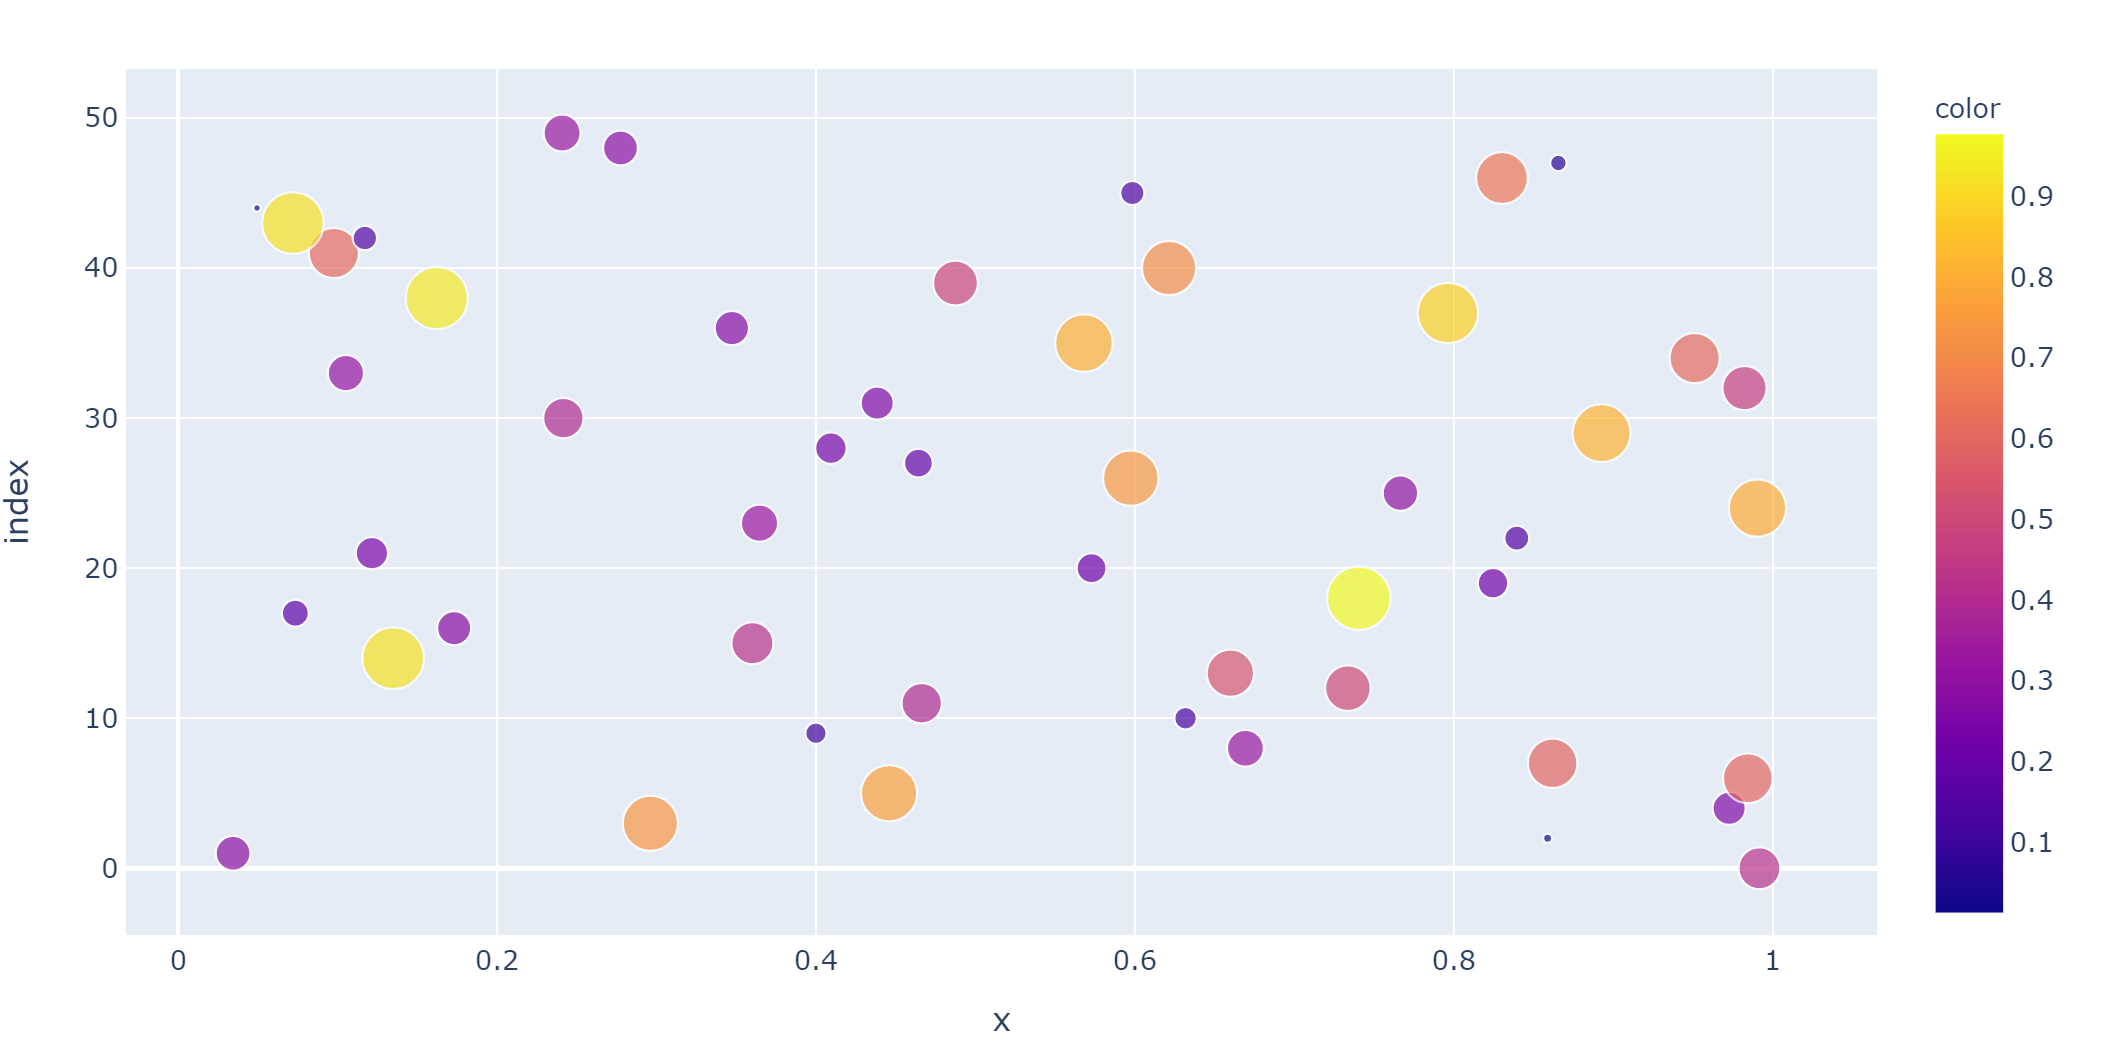
Altiar
Altair is a simple, user-friendly, and consistent statistical visualization python library based on Vega-Lite. Altair allows you to create meaningful, elegant, and useful visualizations fast with just a few lines of code.
When to use Altier?
- If you want hassle-free interactive data visualization.
- Apply transformations on your data quickly and effectively.
- If you want to create declarative statistical visualizations.
- Create stacked, layered, faceted, and repeated charts.
Usage Example


Folium
Folium is a beautiful Python geovisualization library used for plotting maps. Folium uses the mapping abilities of the Leaflet.js enabling interactive map visualizations.
Folium gives you the ability to zoom in and out on your maps, click and drag them, or even add markers on them.
When to use Folium?
- If you want to create interactive maps, Folium is your best choice.
Usage Example


Conclusion
Data visualization is the way a developer or a data scientist communicate their data to a broad audience. Building better, effective data visualization is a valuable skill that every data scientist must work on developing.
Whenever you want to create some visualizations, here’s a rule of thumb to follow, if you’re new to data science and Python and only want to create static charts, go with Seaborn. For network analysis, use NetworkX. If you want to create interactive visualization to present, use Plotly, but if you want to use this visualization for the web, then go with Gleam. Finally, if you want to create interactive maps, Folium is your friend.
In the end, you can create compelling visualizations no matter what library you choose. And remember, complex is not always the answer. Always go with the library the provides the features you want fro your visualizations.


No comments:
Post a Comment