Pandas is the definitive library for performing data analysis with Python. It was originally developed by a company called AQR Capital Management but was open-sourced for general use in 2009.
It rapidly became the go-to tool for data analysis for Python users and now has a huge array of features for data extraction, manipulation, visualisation and analysis.
Pandas has many useful methods and functions here are ten things you might not know about the library.
Pandas can be pip installed if you don’t already have it. The full documentation, with some excellent general data analysis tutorials, can be found here.
pip install pandasThroughout the article, I will provide code examples using the ‘autos’ data set which consists of a variety of characteristics of a car and its corresponding insurance risk rating. This data set is typically used as a machine learning classification task where the objective is to predict the risk rating of the car.
Data analysis is an important preliminary step before building a machine learning model.
If you have Scikit-learn the data set can be imported using the code below. Alternatively, it can be downloaded here.
1. You can create Excel-like pivot tables
Pivot table are generally regarded as one of the most powerful features of Excel. They enable a user to quickly understand patterns and features contained within very large data sets by grouping, filtering and performing calculations across variables.
The Pandas library contains methods that allow you to create pivot tables very similar to those found in Excel and other spreadsheet tools.
The code below uses a Pandas pivot table to compare the insurance risk rating for cars based on the number of cylinders they have.


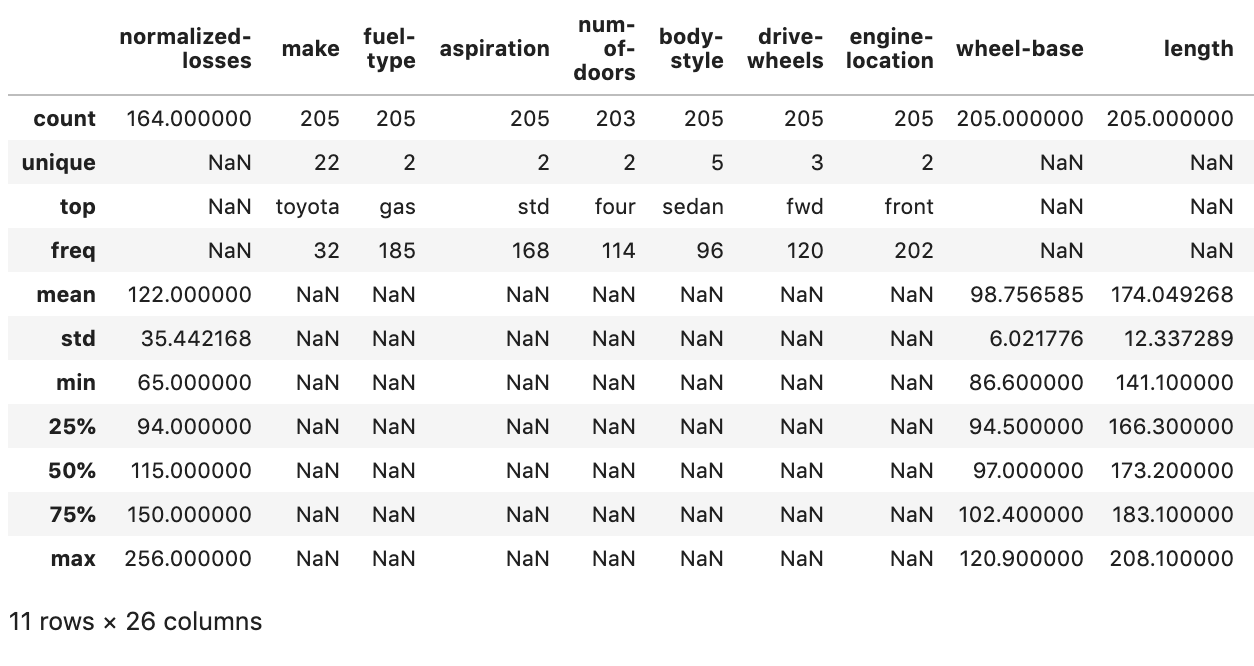
2. The describe() function can also be used to analyse non-numeric features
The pandas describe() function quickly generates a summary of descriptive statistics for, by default, only numerical values in a data set. This extremely useful Pandas tool is, however, also capable of providing a summary of non-numeric columns by simply adding the include=’all’ argument.
This is very helpful for including information such as the dimensionality of categorical variables which helps to inform transformation strategies for machine learning.
data.describe(include='all')
3. Built-in statistical functions
Much like Excel Pandas includes a wide range of computational tools for applying common statistical methods to your data. For example, correlations between variables in a data set can quickly be computed using the corr() method.
round(data.corr(),2)

4. Plotting functionality
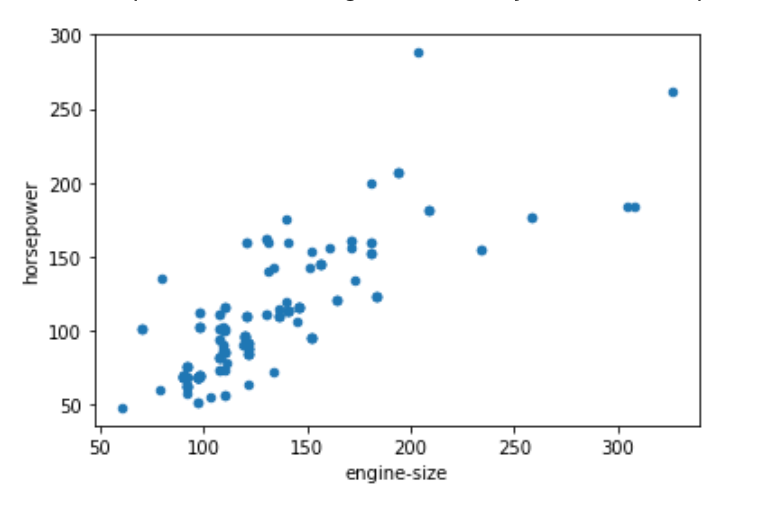
Pandas has built-in plotting functionality which allows you to quickly create the most common types of plots from your data frames, groupbys or pivot tables.
The below code creates a scatter plot comparing engine size and horsepower in our data frame.
data.plot.scatter(x='engine-size', y='horsepower')
Simply adding .plot() to the pivot table I created earlier produces a plot of the summarised data.
pivot_table.plot()

5. Even prettier plots
By default, the Pandas plotting methods use Matplotlib as the backend for the visualisations. However, Pandas also supports a wide range of other Python plotting libraries.
To change the backend and use Bokeh for the visualisations, for example, simply use the following code.
This gives a richer, interactive visualisation.


For a more detailed tutorial on using different backends for Pandas visualisations see my previous article below.
6. Tools for the split-apply-combine strategy
The split-apply-combine as a useful strategy for data analysis was first outlined in a paper by Hadley Wickham in 2011. This paper details a common data analysis pattern whereby data is first broken down into sensible, manageable chunks or segments, operations are performed on each individual segment and then pieced back together again to form comparisons.
This data analysis pattern is seen in pivot tables, as we have described above and in SQL group by statements. In addition to pivot tables, Pandas provides another method that utilises this strategy known as groupby().
This method, in a single line of code, allows you to break down your data set into segments, perform some statistical computation or calculation and then piece those segments back together again to compare them.
The following code segments the data by unique values in the target variable, computes the mean for each column and then displays the results.


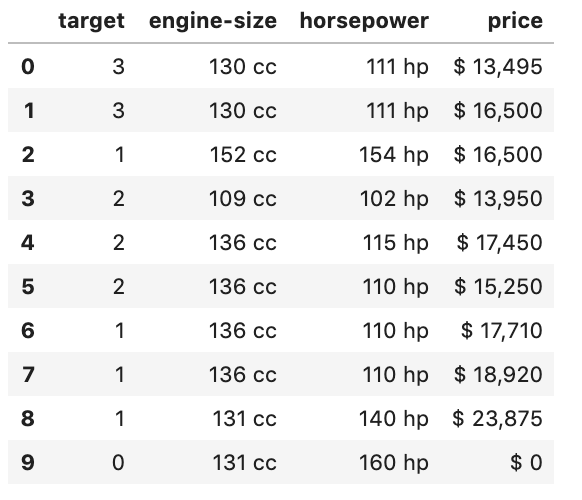
7. Prettier tables with style
If you want to share the results of your data analysis using Pandas then the chances are that you will want to make your data tables look a bit nicer and easier to digest by a human. Pandas has a range of Styling options to control how results are displayed in data frames.
The style options can change how numbers are displayed, e.g. add a % sign to a percentage point, control the number of decimal places, add conditional formatting to results or highlight specific values.
The below code applies appropriate styling to a selection of columns in our data set. The output is now much easier to read.

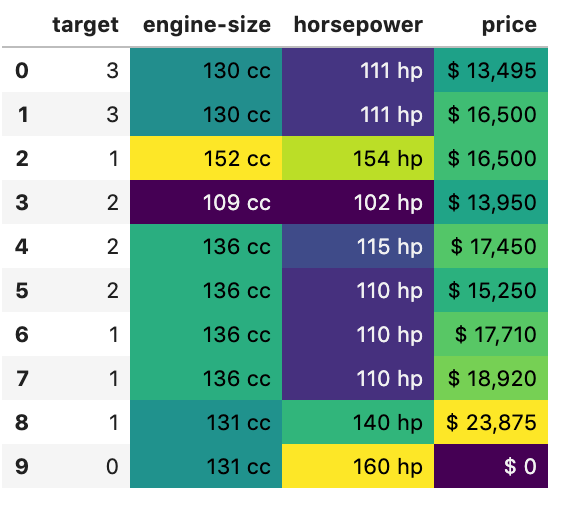
8. Easily create a heatmap with built-in styles
Pandas has some common style patterns built-in. You can use one of these to easily create a heatmap.
The code below applies heatmap formatting to the data_summary we created earlier.

9. Use Pandas options to control the display
Pandas has a range of options that you can set that control the output of your data frames. These can be used to control things like the maximum number of rows or columns to display, the number of decimal places to use when displaying floats and the format in which dates are displayed.
10. Add captions to tables
There are also a range of styles that can be added to tables that enhance the display outside of the data.
For example, you can add a caption to a table like this.


No comments:
Post a Comment