Wrangle, aggregate, filter data at scale using your friendly SQL with a twist!

Note
This article covers detailed concepts pertaining to Spark, SQL and DataFrames. Besides this we also cover a hands-on case study around working with SQL at scale using Spark SQL and DataFrames. If the article seems a bit overwhelming or really long to you at the first glance, feel free to check out the same in more bite-sized chunks in the following links at opensource.com
- Scaling relational databases with Apache Spark SQL and DataFrames
- How to use Spark SQL: A hands-on tutorial
I hope this helps you out on your own journey with Spark and SQL!
Introduction
Relational Databases are here to stay, regardless of the hype as well as the advent of newer databases often popularly termed as ‘NoSQL’ databases. The simple reason is that these databases enforce essential structure, constraints and provide a nice declarative language to query data, which we love — SQL! However, scale has always been a problem with relational databases. Most enterprises now in the 21st century are loaded with rich data stores and repositories, and want to take maximum advantage of their ‘Big Data’ for actionable insights. Relational databases might be popular, but they don’t scale very well unless we invest in a proper Big Data management strategy. This involves thinking about potential data sources, data volume, constraints, schemas, ETL (extract-transform-load), access and querying patterns and much more!
This article will cover some excellent advances made for leveraging the power of relational databases, but ‘at scale,’ using some of the newer components from Apache Spark — Spark SQL and DataFrames. Most notably, we will cover the following topics.
1. Motivation and Challenges with Scaling Relational Databases
2. Understanding Spark SQL & DataFrames
- Goals
- Architecture and Features
- Performance
3. A real-world case study on Spark SQL with hands-on examples
Thus, we will be looking at the major challenges and motivation for people working so hard, and investing time in building new components in Apache Spark, so that we could perform SQL at scale. We will also understand major architecture, interfaces, features and performance benchmarks for Spark SQL and DataFrames. Lastly, but most importantly, we will cover a real-world case study on analyzing intrusion attacks based on KDD 99 Cup Data using Spark SQL and DataFrames by leveraging Databricks Cloud Platform for Spark!
Motivation and Challenges on Scaling Relational Databases for Big Data
Relational data stores are easy to build and query. Also, users as well as developers often prefer writing easy to interpret, declarative queries in a human-like readable language such as SQL. However, as data starts increasing in volume and variety, the relational approach does not scale well enough for building big data applications and analytical system. Following are some major challenges.
- Dealing with different types and sources of data which can be structured, semi-structured and unstructured.
- Building ETL pipelines to and from various data sources, which may lead to developing a lot of specific custom code, which increases technical debt over time.
- Capability to perform both traditional BI (Business Intelligence)-based analytics and advanced analytics (machine learning, statistical modeling etc.) the latter of which is definitely challenging to perform in relational systems.
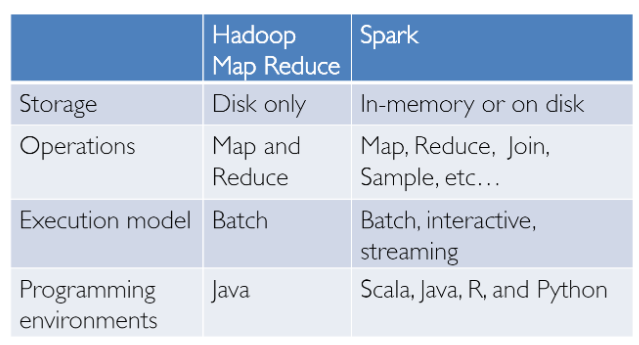
Big Data Analytics is not something which was just invented yesterday! We have had success in this domain with Hadoop and the Map-Reduce paradigm. This was powerful, but often slow, and also gave users a low-level, procedural programming interface which required people to write a lot of code for even very simple data transformations. However, once Spark was released, it really revolutionized the way big data analytics was done with focus on in-memory computing, fault tolerance, high-level abstractions and ease of use.
From then, several frameworks and systems like Hive, Pig and Shark (which evolved into Spark SQL) provided rich relational interfaces and declarative querying mechanisms to Big Data stores. The challenge remained that these tools were either relational or procedural-based and we couldn’t have the best of both worlds.
However in the real-world, most data and analytical pipelines might involve a combination of relational and procedural code. Thus, forcing users to choose either one ends up complicating things and increasing user efforts in developing, building and maintaining different applications and systems. Apache Spark SQL builds on the previously mentioned SQL-on-Spark effort, called Shark. Instead of forcing users to pick between a relational or a procedural API, Spark SQL tries to enable users to seamlessly intermix the two and perform data querying, retrieval and analysis at scale on Big Data.
Understanding Spark SQL & DataFrames
Spark SQL essentially tries to bridge the gap between the two models we mentioned previously — the relational and procedural models by two major components.
- Spark SQL provides a DataFrame API that can perform relational operations on both external data sources and Spark’s built-in distributed collections — at scale!
- To support the a wide variety of diverse data sources and algorithms in big data, Spark SQL introduces a novel extensible optimizer called Catalyst, which makes it easy to add data sources, optimization rules, and data types for advanced analytics such as machine learning.
Essentially, Spark SQL leverages the power of Spark to perform distributed, robust, in-memory computations at massive scale on Big Data. Spark SQL provides state-of-the-art SQL performance, and also maintains compatibility with all existing structures and components supported by Apache Hive (a popular Big Data Warehouse framework) including data formats, user-defined functions (UDFs) and the metastore. Besides this, it also helps in ingesting a wide variety of data formats from Big Data sources and enterprice data warehouses like JSON, Hive, Parquet and so on, and perform a combination of relational and procedural operations for more complex, advanced analytics.
Goals
Let’s look at some of the interesting facts about Spark SQL, it’s usage, adoption and goals, some of which I will shamelessly once again copy from the excellent and original paper on Relational Data Processing in Spark. Spark SQL was first released in May 2014, and is perhaps now one of the most actively developed components in Spark. Apache Spark is definitely the most active open source project for big data processing, with hundreds of contributors. Besides being just an open-source project, Spark SQL has actually started seeing mainstream industry adoption! It has already been deployed in very large scale environments. An excellent case-study has been mentioned by Facebook where they talk about ‘Apache Spark @Scale: A 60 TB+ production use case’ — Here, they were doing data preparation for entity ranking and their Hive jobs used to take several days and had many challenges, but they were able to successfully able to scale and increase performance using Spark. Do check out the interesting challenges they faced in this journey!
Another interesting fact is that 2/3rd of customers of Databricks Cloud (hosted service running Spark), use Spark SQL within other programming languages. We will also showcase a hands-on case study using Spark SQL on Databricks in this article. Stay tuned for that! The major goals for Spark SQL as defined by it’s creators are as follows.
- Support relational processing both within Spark programs (on native RDDs) and on external data sources using a programmer friendly API.
- Provide high performance using established DBMS techniques.
- Easily support new data sources, including semi-structured data and external databases amenable to query federation.
- Enable extension with advanced analytics algorithms such as graph processing and machine learning.
Architecture and Features
We will now take a look at the key features and architecture around Spark SQL and DataFrames. Some key concepts to keep in mind here would be around the Spark eco-system which has been constantly evolving over time.

RDDs or “Resilient Distributed Datasets” is perhaps the biggest contributor behind all the success stories of Spark. It is basically a data structure or rather , a distributed memory abstraction to be more precise, that allows programmers to perform in-memory computations on large distributed clusters while retaining aspects like fault tolerance. You can also parallelize a lot of computations, transformations and track the whole lineage of transformations, which can help in efficiently recomputing lost data. Spark enthusiasts do read the excellent paper around RDDs, ‘Resilient Distributed Datasets: A Fault-Tolerant Abstraction for In-Memory Cluster Computing’. Also, Spark works with the concept of drivers and workers as depicted in the following figure.

You can typically create an RDD by reading in data from files, databases, parallelizing existing collections or even transformations. Typically transformations are operations which can be used to transform the data into different aspects and dimensions depending on the way we want to wrangle and process the data. They are also lazily evaluated meaning that even if you define a transformation, the results are not computed till you apply an action which typically requires a result to be returned to the driver program (and it computed all applied transformations then!).

Shout out to fellow data scientist and friend Favio Vázquez and his excellent article on Deep Learning With Apache Spark from which I got some excellent ideas and content including the preceding figure. Do check it out!
Now that we know about the general architecture of how Spark works, let’s take a closer look into Spark SQL. Typically, Spark SQL runs as a library on top of Spark, as we have seen in the figure covering the Spark eco-system. The following figure gives a more detailed peek into the typical achitecture and interfaces of Spark SQL.
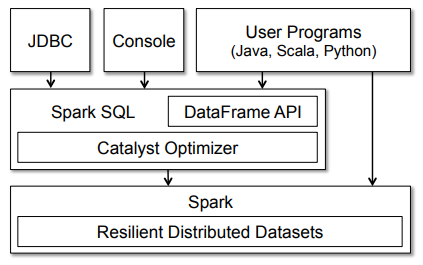
The figure clearly shows us the various SQL interfaces, which can be accessed through JDBC/ODBC or through a command-line console, as well as the DataFrame API integrated into Spark’s supported programming languages (we will be using Python!). The DataFrame API is very powerful and allows users to finally intermix procedural and relational code! Advanced functions like UDFs (user defined functions) can also be exposed in SQL, which can be used by BI tools.
Spark DataFrames are very interesting and help us leverage the power of Spark SQL and combine its procedural paradigms as needed. A Spark DataFrame is basically a distributed collection of rows (Row types) with the same schema. It is basically a Spark Dataset organized into named columns. A point to note here is that Datasets, are an extension of the DataFrame API that provides a type-safe, object-oriented programming interface. Hence, they are available only in Java and Scala and we will, therefore, be focusing on DataFrames.

A DataFrame is equivalent to a table in a relational database (but with more optimizations under the hood), and can also be manipulated in similar ways to the “native” distributed collections in Spark (RDDs). Spark DataFrames have some interesting properties, some of which are mentioned below.
- Unlike RDDs, DataFrames usually keep track of their schema and support various relational operations that lead to a more optimized execution.
- DataFrames can be constructed from tables, just like existing Hive tables in your Big Data infrastructure, or even from existing RDDs.
- DataFrames can be manipulated with direct SQL queries and also using the DataFrame DSL (domain-specific language), where we can use various relational operators and transformers such as where and groupBy
- Also, each DataFrame can also be viewed as an RDD of Row objects, allowing users to call procedural Spark APIs such as map
- Finally, a given, but a point to always remember, unlike traditional dataframe APIs (pandas), Spark DataFrames are lazy, in that each DataFrame object represents a logical plan to compute a dataset, but no execution occurs until the user calls a special “output operation” such as save.
This should give you enough perspective on Spark SQL, DataFrames, essential features, concepts, architecture and interfaces. Let’s wrap up this section by taking a look at performance benchmarks.
Performance
Releasing a new feature without the right optimizations can be deadly, and the folks who built Spark did tons of performance tests and benchmarking! Let’s take a look at some interesting results. The first figure showcasing some results is depicted below.
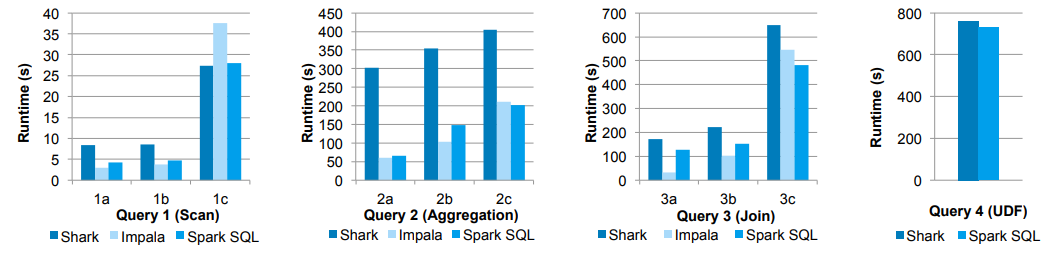
In these experiments, they compared the performance of Spark SQL against Shark and Impala using the AMPLab big data benchmark, which uses a web analytics workload developed by Pavlo et al. The benchmark contains four types of queries with different parameters performing scans, aggregation, joins and a UDF-based MapReduce job. The dataset was 110 GB of data after compression using the columnar Parquet format. We see that in all queries, Spark SQL is substantially faster than Shark, and generally competitive with Impala. The Catalyst optimizer is responsible for this, which reduces CPU overhead (we shall cover this briefly). This feature makes Spark SQL competitive with the C++ and LLVM-based Impala engine in many of these queries. The largest gap from Impala is in query 3a where Impala chooses a better join plan, because the selectivity of the queries makes one of the tables very small.
Following graphs show some more performance benchmarks for DataFrames and regular Spark APIs and Spark + SQL.

Finally, the following graph shows a nice benchmark result of DataFrames vs. RDDs in different languages, which gives an interesting perspective on how optimized DataFrames can be!

Secret to Performance — The Catalyst Optimizer
Why is Spark SQL so fast and optimized? The reason is, because of a new extensible optimizer, Catalyst, based on functional programming constructs in Scala. While we won’t go into too extensive details about Catalyst here, it is worth a mention since it helps in optimizing DataFrame operations and queries.

Catalyst’s extensible design has two purposes.
- Making it easy to add new optimization techniques and features to Spark SQL, especially to tackle diverse problems around ‘Big Data’, semi-structured data and advanced analytics.
- Ease of being able to extend the optimizer — for example, by adding data source-specific rules that can push filtering or aggregation into external storage systems, or support for new data types.
Catalyst supports both rule-based and cost-based optimization. While extensible optimizers have been proposed in the past, they have typically required a complex domain-specific language to specify rules. Usually, this leads to having a significant learning curve and maintenance burden. In contrast, Catalyst uses standard features of the Scala programming language, such as pattern-matching, to let developers use the full programming language while still making rules easy to specify.

At its core, Catalyst contains a general library for representing trees and applying rules to manipulate them. On top of this framework, it has libraries specific to relational query processing (e.g., expressions, logical query plans), and several sets of rules that handle different phases of query execution: analysis, logical optimization, physical planning, and code generation to compile parts of queries to Java bytecode. Interested in knowing more details about Catalyst and doing a deep-dive? You can check out an excellent article from Databricks!
Hands-on Case Study with Spark SQL
We will now do a simple tutorial based on a real-world dataset to look at how to use Spark SQL. We will be using Spark DataFrames but the focus will be more on using SQL. I will be covering a detailed discussion around Spark DataFrames and common operations in a separate article. I love using cloud services for my machine learning, deep learning and even Big Data Analytics needs. Instead of painfully setting up your own Spark cluster, use one of the best in the Cloud! We will be using the Databricks Platform for our Spark needs! Databricks is a company founded by the creators of Apache Spark, that aims to help clients with cloud-based big data processing using Spark.

The simplest way (and free of charge) is to go to the Try Databricks page and sign up for an account using the community edition where you get a cloud-based cluster, which is a single node cluster with 6 GB and unlimited notebooks, not bad for a free version! I definitely recommend using the Databricks Platform if you have serious needs for analyzing Big Data!
Let’s get started with our case study now, feel free to create a new notebook from your home screen in Databricks or your own Spark cluster as depicted in the following snapshot.

You can also import my notebook containing the entire tutorial but do run every cell and play around with it and explore instead of just reading through it. Unsure of how to use Spark on Databricks? Follow this short but useful tutorial and get started today!
This tutorial will familiarize you with essential Spark capabilities to deal with structured data often obtained from databases or flat files. We will explore typical ways of querying and aggregating relational data by leveraging concepts of DataFrames and SQL using Spark. We will work on an interesting dataset from the KDD Cup 1999 and try to query the data using high level abstrations like the dataframe which has already been a hit in popular data analysis tools like R and Python. We will also look at how easy it is to build data queries using the SQL language, which you have learnt, and retrieve insightful information from our data. This also happens at scale without us having to do a lot more since Spark distributes these data structures efficiently in the back-end, which makes our queries scalable and as efficient as possible. We start by loading some basic dependencies.
import pandas as pd
import matplotlib.pyplot as plt
plt.style.use('fivethirtyeight')
Data Retrieval
We will use data from the KDD Cup 1999, which is the data set used for The Third International Knowledge Discovery and Data Mining Tools Competition, which was held in conjunction with KDD-99 The Fifth International Conference on Knowledge Discovery and Data Mining. The competition task was to build a network intrusion detector, a predictive model capable of distinguishing between bad connections, called intrusions or attacks, and good, normal connections. This database contains a standard set of data to be audited, which includes a wide variety of intrusions simulated in a military network environment.
We will be using the reduced dataset kddcup.data_10_percent.gz containing nearly half a million nework interactions, since we would be downloading this Gzip file from the web locally, and then work on the same. If you have a good, stable internet connection, feel free to download and work with the full dataset available as kddcup.data.gz.
Working with data from the web
Dealing with datasets retrieved from the web can be a bit tricky in Databricks. Fortunately, we have some excellent utility packages like dbutils which help in making our job easier. Let's take a quick look at some essential functions for this module.
dbutils.help()
This module provides various utilities for users to interact with the rest of Databricks.fs: DbfsUtils -> Manipulates the Databricks filesystem (DBFS) from the console
meta: MetaUtils -> Methods to hook into the compiler (EXPERIMENTAL)
notebook: NotebookUtils -> Utilities for the control flow of a notebook (EXPERIMENTAL)
preview: Preview -> Utilities under preview category
secrets: SecretUtils -> Provides utilities for leveraging secrets within notebooks
widgets: WidgetsUtils -> Methods to create and get bound value of input widgets inside notebooks
Retrieve and store data in Databricks
We will now leverage the python urllib library to extract the KDD Cup 99 data from their web repository, store it in a temporary location, and then move it to the Databricks filesystem, which can enable easy access to this data for analysis
Note: If you skip this step and download the data directly, you may end up getting a
InvalidInputException: Input path does not existerror

Building the KDD Dataset
Now that we have our data stored in the Databricks filesystem, let’s load up our data from the disk into Spark’s traditional abstracted data structure, the Resilient Distributed Dataset (RDD)

You can also verify the type of data structure of our data (RDD) using the following code.
type(raw_rdd)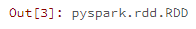
Building a Spark DataFrame on our Data
A Spark DataFrame is an interesting data structure representing a distributed collecion of data. Typically the entry point into all SQL functionality in Spark is the SQLContext class. To create a basic instance of this call, all we need is a SparkContext reference. In Databricks, this global context object is available as sc for this purpose.

Splitting the CSV data
Each entry in our RDD is a comma-separated line of data which we first need to split before we can parse and build our dataframe.
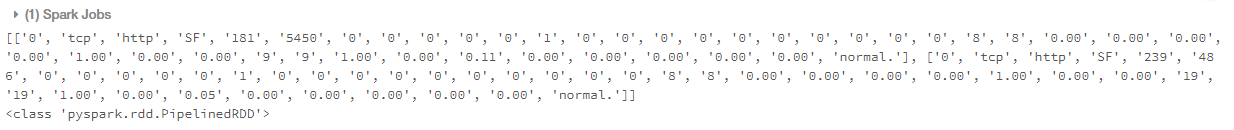
Check the total number of features (columns)
We can use the following code to check the total number of potential columns in our dataset.
len(csv_rdd.take(1)[0])Out[57]: 42
Data Understanding and Parsing
The KDD 99 Cup data consists of different attributes captured from connection data. The full list of attributes in the data can be obtained here and further details pertaining to the description for each attribute\column can be found here. We will just be using some specific columns from the dataset, the details of which are specified as follows.
We will be extracting the following columns based on their positions in each datapoint (row) and build a new RDD as follows.

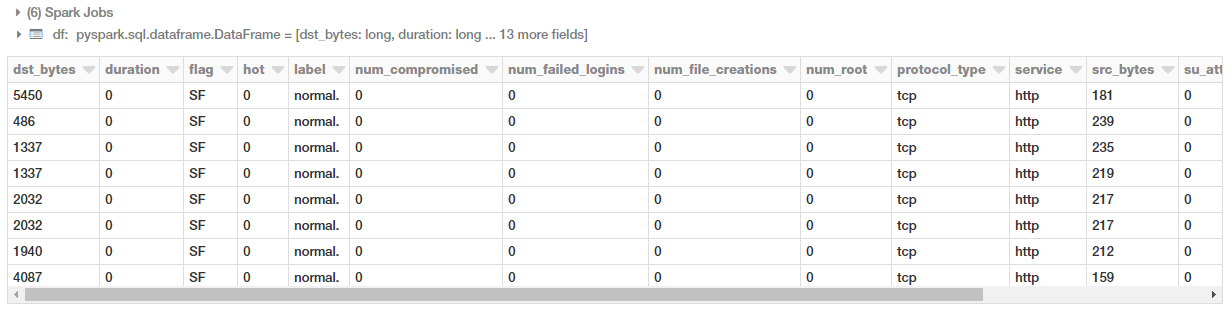
Constructing the DataFrame
Now that our data is neatly parsed and formatted, let’s build our DataFrame!
You can also now check out the schema of our dataframe using the following code.
df.printSchema()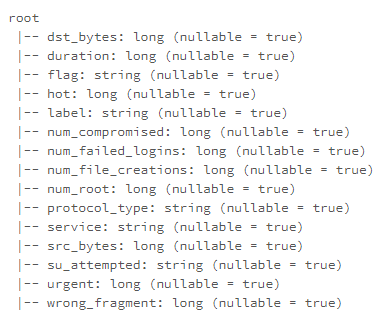
Building a temporary table
We can leverage the registerTempTable() function to build a temporaty table to run SQL commands on our DataFrame at scale! A point to remember is that the lifetime of this temp table is tied to the session. It creates an in-memory table that is scoped to the cluster in which it was created. The data is stored using Hive's highly-optimized, in-memory columnar format.
You can also check out saveAsTable() which creates a permanent, physical table stored in S3 using the Parquet format. This table is accessible to all clusters. The table metadata including the location of the file(s) is stored within the Hive metastore.
help(df.registerTempTable)
df.registerTempTable("connections")Executing SQL at Scale
Let’s look at a few examples of how we can run SQL queries on our table based off our dataframe. We will start with some simple queries and then look at aggregations, filters, sorting, sub-queries and pivots in this tutorial.
Connections based on the protocol type
Let’s look at how we can get the total number of connections based on the type of connectivity protocol. First, we will get this information using normal DataFrame DSL syntax to perform aggregations.

Can we also use SQL to perform the same aggregation? Yes, we can leverage the table we built earlier for this!
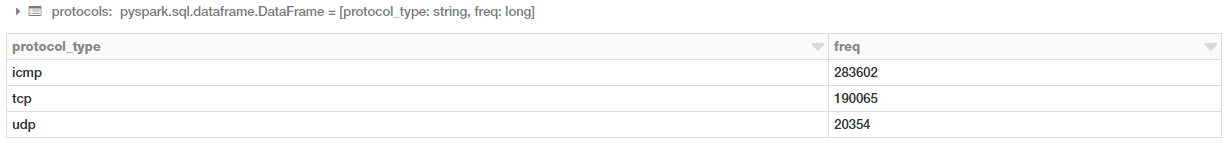
You can clearly see, that you get the same results and you do not need to worry about your background infrastructure or how the code is executed. Just write simple SQL!
Connections based on good or bad (attack types) signatures
We will now run a simple aggregation to check the total number of connections based on good (normal) or bad (intrusion attacks) types.

We have a lot of different attack types. We can visualize this in the form of a bar chart. The simplest way is to use the excellent interface options in the Databricks notebook itself!

This gives us the following nice looking bar chart! Which you can customize further by clicking on Plot Options as needed.

Another way is to write the code yourself to do it. You can extract the aggregated data as a pandas DataFrame and then plot it as a regular bar chart.

Connections based on protocols and attacks
Let’s look at which protocols are most vulnerable to attacks now based on the following SQL query.

Well, looks like ICMP connections followed by TCP connections have had the maximum attacks!
Connection stats based on protocols and attacks
Let’s take a look at some statistical measures pertaining to these protocols and attacks for our connection requests.
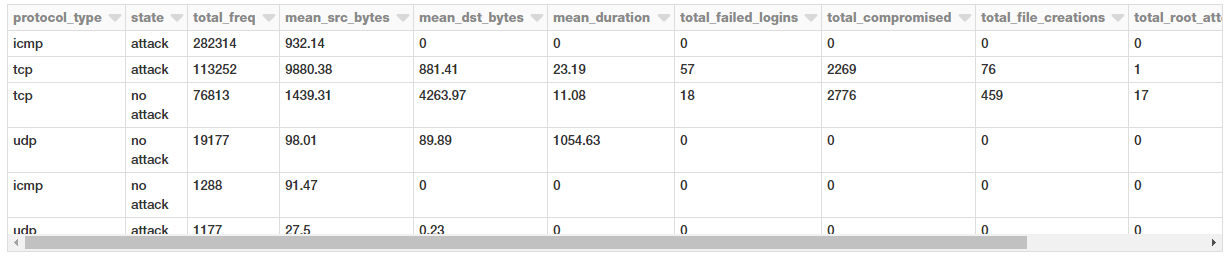
Looks like average amount of data being transmitted in TCP requests are much higher which is not surprising. Interestingly, attacks have a much higher average payload of data being transmitted from the source to the destination.
Filtering connection stats based on the TCP protocol by service and attack type
Let’s take a closer look at TCP attacks given that we have more relevant data and statistics for the same. We will now aggregate different types of TCP attacks based on service, attack type and observe different metrics.

There are a lot of attack types and the preceding output shows a specific section of the same.
Filtering connection stats based on the TCP protocol by service and attack type
We will now filter some of these attack types by imposing some constraints based on duration, file creations, root accesses in our query.

Interesting to see multihop attacks being able to get root accesses to the destination hosts!
Subqueries to filter TCP attack types based on service
Let’s try to get all the TCP attacks based on service and attack type such that the overall mean duration of these attacks is greater than zero (> 0). For this, we can do an inner query with all aggregation statistics and then extract the relevant queries and apply a mean duration filter in the outer query as shown below.

This is nice! Now an interesting way to also view this data is to use a pivot table where one attribute represents rows, and another one represents columns. Let’s see if we can leverage Spark DataFrames to do this!
Building a Pivot Table from Aggregated Data
Here, we will build upon the previous DataFrame object we obtained where we aggregated attacks based on type and service. For this, we can leverage the power of Spark DataFrames and the DataFrame DSL.

We get a nice neat pivot table showing all the occurrences based on service and attack type!
Next Steps
I would encourage you to go out and play with Spark SQL and DataFrames, you can even import my notebook and play with it yourself in your own account.
Feel free to refer to my GitHub repository also for all the code and notebooks used in this article. What we didn’t cover here includes the following.
- Joins
- Window Functions
- Detailed operations and Transformations of Spark DataFrames
There are plenty of articles\tutorials available online so I would recommend you to check them out. Some useful resources for you to check out include, the complete guide to Spark SQL from Databricks.
Thinking of working with JSON data but unsure of using Spark SQL. They support it! Check out this excellent guide to JSON support in Spark SQL.
Interested in advanced concepts like window functions and ranks in SQL? Check out this excellent article on Window Functions in Spark SQL
I will also write a followup article to this covering some of these concepts in an intuitive way which should be easy for you to understand. Stay tuned!
You can directly access my notebook on Databricks by going to this link and import it directly and play around with it
All the code and resources for this tutorial is available on my GitHub
You can also access my tutorial as a Jupyter Notebook in case you want to use it offline.
Have feedback for me? Or interested in working with me on research, data


No comments:
Post a Comment