Now I’ve stepped to BigData technologies, I’ve decided to write some posts on Medium and my first post is about a topic that is quite close to an Oracle database topic … Apache Spark’s execution plan.
Execution plan aim
An execution plan is the set of operations executed to translate a query language statement (SQL, Spark SQL, Dataframe operations etc.) to a set of optimized logical and physical operations.
To sum up, it’s a set of operations that will be executed from the SQL (or Spark SQL) statement to the DAG which will be send to Spark Executors.
If you don’t know what a DAG is, it stands for “Directed Acyclic Graph”. A DAG is an acyclic graph produced by the DAGScheduler in Spark. As a graph, it is composed of vertices and edges that will represent RDDs and operations (transformations and actions) performed on them.
On Spark, the optimizer is named “Catalyst” and can be represented by the schema below. It will produce different types of plans:
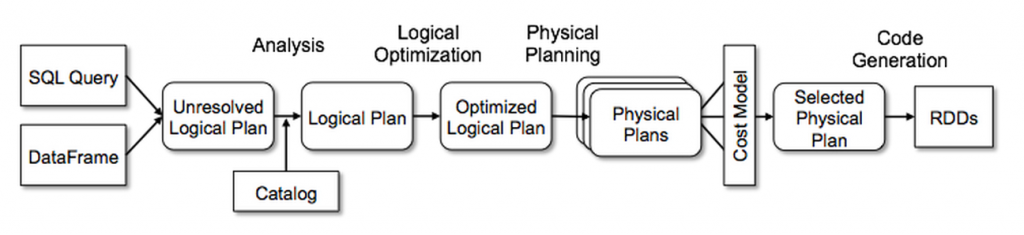
Operation names are:
- Analysis
- Logical Optimization
- Physical Planning
- Cost Model Analysis
- Code Generation
And those operations will produce various plans:
- Unresolved logical plan
- Resolved logical plan
- Optimized logical plan
- Physical plans
The goal of all these operations and plans is to produce automatically the most effective way to process your query.
Generating plans
In order to generate plans, you have to deal with Dataframes regardless they come from SQL or raw dataframe. And the function you will use is (in Python) explain().
For example, if you have these two dataframes:
itemsSchema = ("id integer, name string, price float")
ordersSchema=("id integer, itemid integer, count integer")items = spark.createDataFrame([[0, "Tomato", 2.0], \
                               [1, "Watermelon", 5.5], \
                               [2, "pineapple", 7.0]], \
                              schema=itemsSchema)orders = spark.createDataFrame([[100, 0, 1], \
                                [100, 1, 1], \
                                [101, 2, 3], \
                                [102,2,8]],\
                               schema=ordersSchema)
You can manipulate them like this:
from pyspark.sql.functions import sumy=(items.join(orders,items.id==orders.itemid, how="inner"))\
        .where(items.id==2)\
        .groupBy("name","price").agg(sum("count")\
        .alias("c"))
or like this:
items.createOrReplaceTempView("ITEMS")
orders.createOrReplaceTempView("ORDERS")x=sql('''select ITEMS.name,
                ITEMS.price,
                SUM(ORDERS.count) as c
         from ITEMS, ORDERS
         where ITEMS.id=ORDERS.itemid
           and ITEMS.id=2
         group by ITEMS.name, ITEMS.price''')
In both cases, you will be able to call explain():
x.explain()
y.explain()
By default, calling explain with no argument will produce a physical plan explanation :
Getting various plans
Before Apache Spark 3.0, there was only two modes available to format explain output.
- explain(extended=False) which displayed only the physical plan
- explain(extended=True) which displayed all the plans (logical and physical)
x.explain(extended=true)
Starting from Apache Spark 3.0, you have a new parameter “mode” that produce expected format for the plan:
- explain(mode=”simple”) which will display the physical plan
- explain(mode=”extended”) which will display physical and logical plans (like “extended” option)
- explain(mode=”codegen”) which will display the java code planned to be executed
- explain(mode=”cost”) which will display the optimized logical plan and related statistics (if they exist)
- explain(mode=”formatted”) which will display a splitted output composed by a nice physical plan outline, and a section with each node details
x.explain(mode="formatted")
What is fun with this formatted output is not so exotic if you come, like me, from the rdbms world 😁
Plans differences
As stated in the beginning of this post, various kinds of plans are generated after many operations processed by the Catalyst Optimizer:
First step: Unresolved Logical plan generation
This plan is generated after a first check that verifies everything is correct on the syntactic field. Next, the semantic analysis is executed and will produced a first version of a logical plan where relation name and columns are not specifically resolved. This produced this kind of result:

Next step: [Analyzed] Logical plan generation
When the unresolved plan has been generated, it will resolve everything that is not resolved yet by accessing an internal Spark structure mentioned as “Catalog” in the previous schema. In this catalog, which can be assimilated to a metastore, a semantic analysis will be produced to verify data structures, schemas, types etc. and if everything goes well, the plan is marked as “Analyzed Logical Plan” and will be formatted like this:

We can see here that, just after the “Aggregate” line, all the previously marked “unresolved alias” are now resolved and correctly typed … specially the sum column.
Next stop: Optimized logical Plan
Once the Logical plan has been produced, it will be optimized based on various rules applied on logical operations (But you have already noticed that all these operations were logical ones: filters, aggregation etc.).
These logical operations will be reordered to optimize the logical plan. When the optimization ends, it will produced this kind of output:

We can see in this plan, that predicates have been pushed down on the LogicalRDD to reduce the data volume processed by the join. We can mention too that filters are pushed to both data structure (one for the “items” dataframe, and one for the “orders” dataframe).
Then, many physical plans are generated and finally a unique physical plan is selected
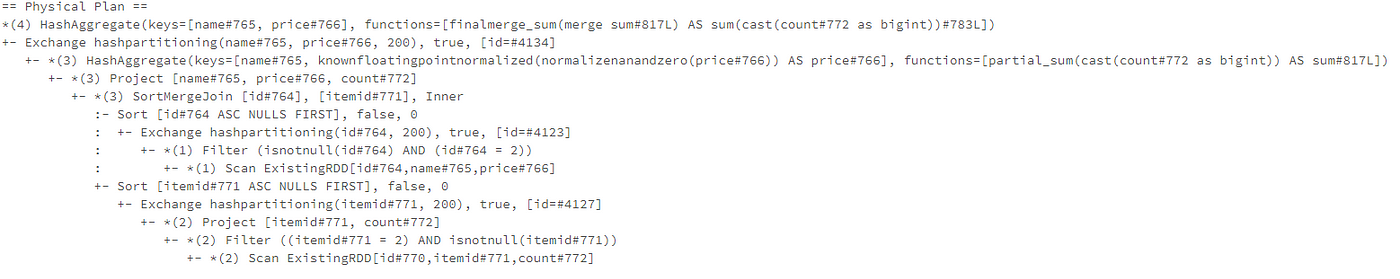
From the optimized logical plan, a plan that describes how it will be physically executed on the cluster will be generated. But before selecting a physical plan, the Catalyst Optimizer will generate many physical plans based on various strategies. Each physical plan will be estimated based on execution time and resource consumption projection and only one plan will be selected to be executed.
Based on our example, the selected physical plan is this one (which is the one that is printed when you use explain() with default parameters)

Spark execution is Lazy, Execution plan generation is not a lazy thing !
Calling explain() function is an operation that will produce all the stuff presented above, from the unresolved logical plan to a selection of one physical plan to execute.
After that, and only after that, the physical plan is executed through one to many stages and tasks in a laziness way.
As a consequence, it won’t be possible to generate an unresolved logical plan by typing something like the code below (which includes a schema error: ids instead of id)
>>> (items.join(orders,items.id==orders.itemid, how="inner"))\
...          .where(items.ids==2)\
...          .groupBy("name","price").agg(sum("count")\
...         .alias("c")).explain(mode="extended")Traceback (most recent call last):
  File "<stdin>", line 2, in <module>
  File "/usr/spark-3.0.0/python/pyspark/sql/dataframe.py", line 1401, in __getattr__
    "'%s' object has no attribute '%s'" % (self.__class__.__name__, name))
AttributeError: 'DataFrame' object has no attribute 'ids'
And how AQE (Adaptive Query Execution) interact with this stuff ???
AQE is a new feature in Spark 3.0 which enables plan changes at runtime.
It collects statistics during plan execution and if Spark detects better plan during execution, it changes them at runtime.
If we put this on an update of the catalyst Optimizer schema, it will give something like that:

However, any changes decided during DAG execution won’t be displayed after calling explain() function. If you want to see these changes, you will have to explore Spark UI and tracking skew partitions splits, joins changes etc.
For example, if you enable AQE (which is not enabled by default), explain call will produce a hint in the physical plan display :

In the explain output, you are hinted this physical plan is not the final plan, but if you have a look at the Spark UI, you will see that the SQL query plan is the final plan and optionally if the plan has been modified :

And … that’s all for today 😉
Laurent


No comments:
Post a Comment