New Features in Oracle Developer Tools for VS Code 21.4.0

In earlier blog posts, I’ve introduced Oracle Developer Tools for VS Code, Oracle’s free extension for Visual Studio Code that enables editing and execution of SQL and PL/SQL (and much more) with Oracle Database and Oracle Autonomous Database. As Visual Studio Code runs on Linux, macOS and Windows, this extension can be used by any Oracle developer.
Many Oracle Developers use Visual Studio Code for writing Python, Java, or C# apps that access the database, calling PL/SQL stored procedures or functions from within their code. With Oracle Developer Tools for VS Code, you can edit stored procedures and functions and test them. Then you can check in the corresponding SQL scripts into source control alongside your application code. I hope you will install this extension (and sign up for an OCI Free Tier account, if you haven’t already) and try it out!
We’ve been adding lots of new features with each release and our recent 21.4 release is no exception. In today’s blog, I’ll highlight the major features in version 21.4, starting with a really exciting one: our new PL/SQL debugger.
Debugging PL/SQL from Visual Studio Code
The PL/SQL Debugger we’ve added in 21.4 uses the same awesome VS Code debugging infrastructure that you’re already familiar with if you’ve debugged any other language in VS Code, for example, setting breakpoints, viewing, changing, and watching variable values, and viewing the stack. You should feel right at home in the PL/SQL debugger.
You can debug your procedure, function, or package by simply setting breakpoints and running it via Oracle Database Explorer, entering in any required parameter values. The PL/SQL Debugger can also listen for calls to a stored procedure or function and start debugging the PL/SQL when they are called. Any application (web app or command line, using any programming language, on any machine) can make the PL/SQL call that kicks off the debugging session. For example, you could debug a stored procedure being called by a web app that resides on a remote web server. Or you could use Visual Studio Code to debug Java (JDBC) code and keep right on debugging when the JDBC app calls a stored procedure, stepping into the PL/SQL code. When you are done debugging the PL/SQL, you seamlessly continue debugging the Java code.
To try out our debugger, you will need to install the extension and create a connection to your database in Oracle Database Explorer. (In this first release, PL/SQL debugging will work with any database except for Autonomous Database — but ADB support is coming).
You will need to configure PL/SQL debugging for first use. In Oracle Database Explorer, right click on a connection name and select PL/SQL Debugger and Compiler Settings.

In the dialog that opens, set the IP address and port number range that will be used by the debugger (the Oracle Database will connect back to your machine using that IP address and one of the ports).

Lower down on the screen in that same dialog, you’ll see a handy SQL script for you to copy to make it easy to grant the necessary debugging privileges and to configure the database ACL so that it can connect back to VS Code. Copy the script and then right click on the Oracle Explorer connection node and select Open New SQL File. Paste the script into the new file, modify it as needed, and then right click in the editor and select Execute All to run the commands.
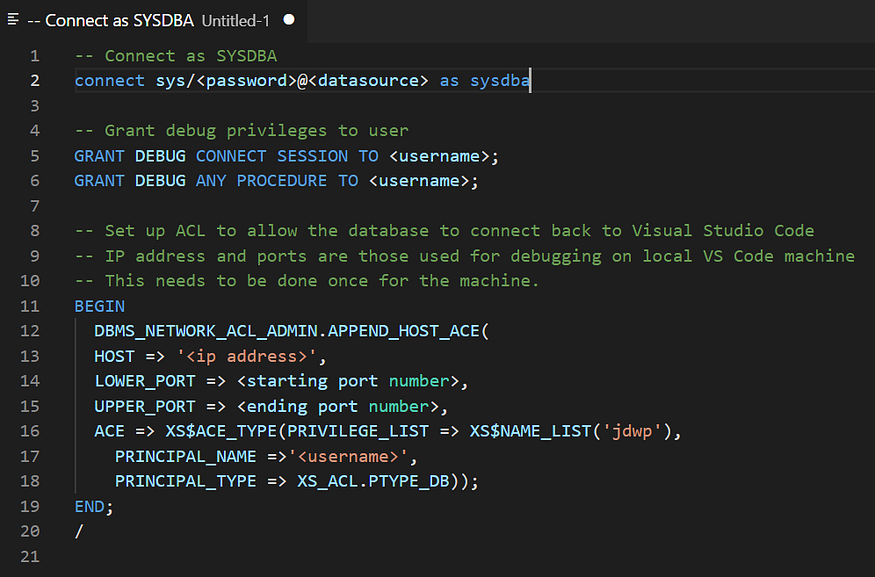
You should only need to run this script once per machine, unless the IP addresses or ports provided in the ACL need to be changed.
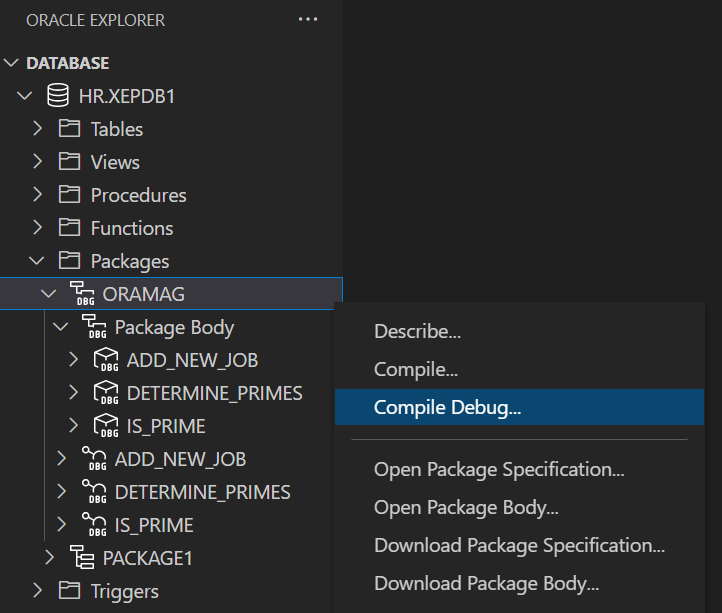
The PL/SQL procedure or function you wish to debug must be compiled with debug information. In Oracle Database Explorer, right click on the procedure/function/package and select Compile Debug from the menu. The Oracle Explorer icons will change to alert you and also to remind you to issue a Compile when done debugging to restore them to their non-debug state.
Once you’ve gotten this far, you are ready to debug! Right click on the procedure/function/package you wish to debug and select Open, or Open Package Body from the menu. Set breakpoints as desired (conditional breakpoints are not supported in this first release). Then, to kick off debugging, from the same menu select Step Into to stop at the first line of PL/SQL, or Run Debug to run to the first breakpoint you’ve set. You’ll be prompted to enter any parameters that the procedure or function requires and then you’ll be debugging!

Debugging PL/SQL called by a SQL Script or an Application
As I mentioned, the PL/SQL Debugger can also listen for calls to a procedure, function, or package and start debugging them when they are called. Any application (web app or command line, using any programming language, on any machine) can make the PL/SQL call, or it can be called via a SQL script running in VS Code.
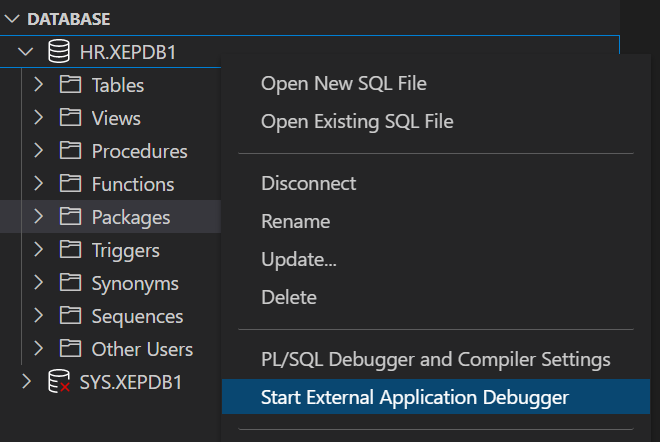
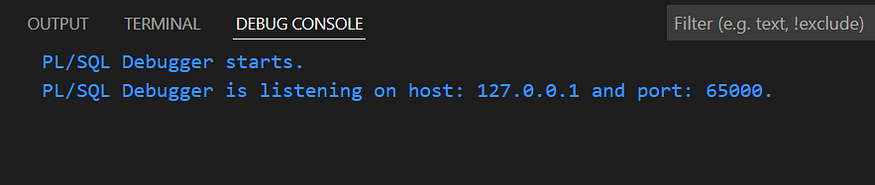
To start the debugger listener, right click on any connection name and select Start External Application Debugger. The Debug Console will display the IP address and port number that is being used. Make a note of these as you will need them in a moment.
Calling the Stored Procedure or Function from a SQL Script
It is easy to execute a SQL and PL/SQL script from Visual Studio Code and in that SQL script you can call the procedure or function you want to debug. To try this out, right click on a connection in Oracle Explorer and select Open New SQL File.

Add the following line in the SQL script at some point before the call is made to the stored procedure or function that you wish to debug:
exec DBMS_DEBUG_JDWP.CONNECT_TCP(‘ip address’, ‘port’);For example:
exec DBMS_DEBUG_JDWP.CONNECT_TCP(‘127.0.0.1’, ‘65000’); The IP address and port number should be the same values reported in the Debug Console that you took note of a moment ago.
At some point in the script after the PL/SQL call is made and debugging is finished, add the line:
exec DBMS_DEBUG_JDWP.DISCONNECT(); 
I recommend that you highlight these connect and disconnect commands and select Bookmark SQL from the SQL editor menu. This will store them in your list of Oracle Developer Tools for VS Code bookmarks so that you can easily paste them into a script anytime you want to do some debugging with a SQL script.
As you did before, in Oracle Database Explorer right click on the procedure or function you wish to debug and select Open, or Open Package Body from the menu. Set breakpoints as desired. When you run the SQL script, you should see a message in the Debug Console stating: a database has connected to the PL/SQL Debugger on host: <youripaddress> and port: <yourport>. This indicates that the Oracle Database has successfully connected back to Visual Studio Code and debugging can begin. With luck, your breakpoint will fire and you will be debugging like a champ!

Debugging PL/SQL Called by Applications
You may have an application (again — a web app or command line, using any programming language, on any machine) that is calling a stored procedure or function. That app might be passing large amounts of data, perhaps using an associative array with thousands of elements, and only one piece of that data is causing a PL/SQL bug to raise it’s ugly head. Wouldn’t it be really nice to debug the PL/SQL with real live data coming from the application, and nail that bug? Why, yes it would!
There’s two ways you can do this. The easiest way is to set an environment variable, ORA_DEBUG_JDWP before the app makes the connection to the database.
The ORA_DEBUG_JDWP environment variable contains the host/ip and the port number that the debugger is listening on. The format is:
host=HostorIPaddr;port=portnumFor example, (from a Windows command shell):
SET ORA_DEBUG_JDWP=host=127.0.0.1;port=65000Or, in the launch.json file in VS Code:
"configurations": [
    {
       "env": {
       "ORA_DEBUG_JDWP": "host=127.0.0.1;port=65000"
        }
    }
]
This environment variable is automatically read by the Oracle client code at database connection time and sent to the database, which then connects back to the VS Code debugger using the host and port. The environment variable is honored by any Oracle application or application driver on any platform that uses the Oracle (thick) Client — a few examples include ODBC, Python (cx_Oracle), ODP.NET Unmanaged Driver, Oracle Call Interface, and Oracle tools like SQL*Plus. It is also supported by ODP.NET Managed Driver and ODP.NET Core. The only driver that currently does not support it is JDBC Thin (but I do have a solution for JDBC devs which I will cover in a moment).
I don’t recommend setting this environment variable at a system level. Instead you should attempt to target it to the environment of the specific app of interest, for example, in the launch.json file in your VS Code project. With a system environment variable, every single new Oracle connection will attempt to connect back to the debugger, even after the debugger is turned off and is no longer listening. This will result in many obnoxious ORA-30683: failure establishing connection to debugger errors.
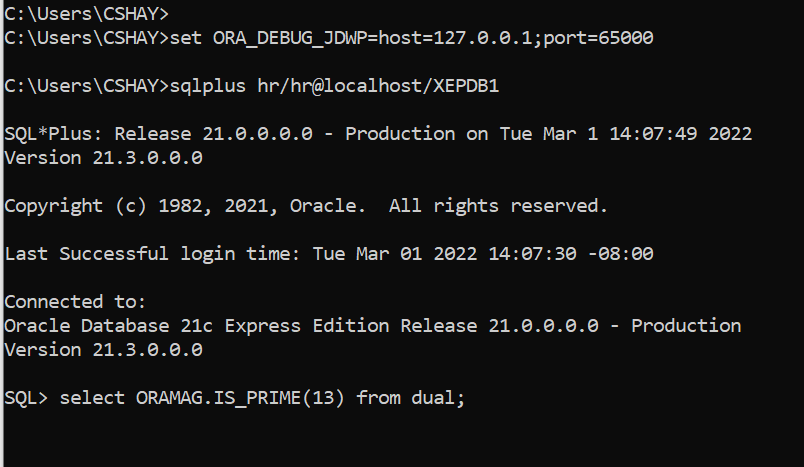
To demonstrate using this environment variable, I will use the ubiquitous, familar tool, SQL*Plus. But I could use any application that connects to the database.
After making sure that the breakpoints are set in my ORAMAG.IS_PRIME package function, I will set the ORA_DEBUG_JDWP environment variable to the values reported in the Debug Console back when we started the debugger listener. Then I will launch SQL*Plus with the connection string to the database. At the SQL*Plus prompt, I execute my stored function and SQL*Plus freezes without returning any results. Why? Because my breakpoint has hit!
As before, I can step through the PL/SQL code and when I finish, control will return to SQL*Plus.

An Alternative to the ORA_DEBUG_JDWP Environment variable
There are some cases where using the ORA_DEBUG_JDWP environment variable won’t work well for you. As I mentioned earlier, JDBC Thin doesn’t support it yet. Or you might be unable to set the environment variable before the connection is made — this could certainly happen with some web apps.
In that case, as long as you are able to modify your application code, you can simply make a call to DBMS_DEBUG_JDWP.CONNECT_TCP at some point before you wish to trigger a breakpoint.
In my JDBC apps, I add a routine like so:
private void startPLSQLDebugging(Connection conn, String host, String port) throws SQLException {String sql = "CALL DBMS_DEBUG_JDWP.CONNECT_TCP(?,?)";
    try (CallableStatement callStmt = conn.prepareCall(sql)) {

      callStmt.setString(1, host);
      callStmt.setString(2, port);
      callStmt.execute();
    }catch (SQLException sqlEx) {
      Util.showError("Error:", sqlEx);
      sqlEx.printStackTrace();
    }
  }
Then I call this routine before executing the PL/SQL stored procedure or function I wish to debug.

When done debugging, I similarly make a call to DBMS_DEBUG_JDWP.DISCONNECT().
I should mention that if you are the only one who will be calling the stored procedure or function, you could simply modify the PL/SQL itself. For example, I could add this line to my stored procedure:
DBMS_DEBUG_JDWP.CONNECT_TCP('127.0.0.1', '65000');And add this at some other point in the PL/SQL:
DBMS_DEBUG_JDWP.DISCONNECT();Any PL/SQL breakpoint you set between those two calls will trigger the VS Code debugger. You probably don’t want to modify the PL/SQL like this if anyone or anything else could be using the stored procedure because they will trigger your breakpoints or get ORA-30683 errors if your debugger stops listening!
I’ll soon be doing separate blog entries walking you though debugging a JDBC, Python and C# app in VS Code side by side with debugging PL/SQL. Subscribe to my blog to get notified when these walkthroughs are posted here.
More Goodies Added in 21.4: IntelliSense on Steroids
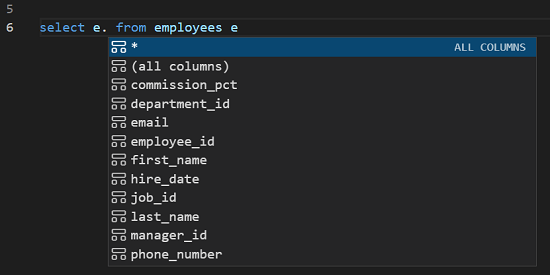
There’s a lot more good stuff in 21.4. For starters, we did a lot of work to improve IntelliSense in our SQL and PL/SQL editor. IntelliSense is what Microsoft calls a group of code completion features such as autocomplete. As you are typing your SQL or PL/SQL, you will get pop up suggestions such as column names, table names, or a list of parameters in a stored procedure or function. You can then select the one you want with an arrow key and then press the tab key to accept the suggestion. This really speeds up your script writing!
In 21.4 we improved the parsing of the SQL fragments to greatly enhance the quality of the popup suggestions. In addition, we added support for table and view aliases. We also added an (all columns) option to include every column in the select list explicitly.
Hover, Go to, and Peek your SQL and PL/SQL
Visual Studio Code has some great code navigation and insight features, in particular Hover, Goto, and Peek. In 21.4, these features now work with SQL and PL/SQL.
To try this out, choose a variable or function or procedure call in your SQL or PL/SQL and hover your mouse over it to see the definition.
For example, I can hover over a call to my IS_PRIME function to see details about it:

Right click on a variable, function or procedure and choose Go to Definition, Go to Type Definition, or Go To Implementations. This will open a new tab containing the code for the definition or implementation.
And I can right click on a variable and Peek at the type definition:
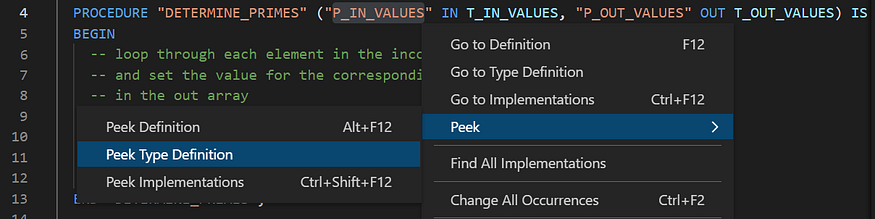
And since I chose Peek rather than Go To, I can edit the definition in my current editor, rather than opening a new one:

User Defined Types in Select Lists
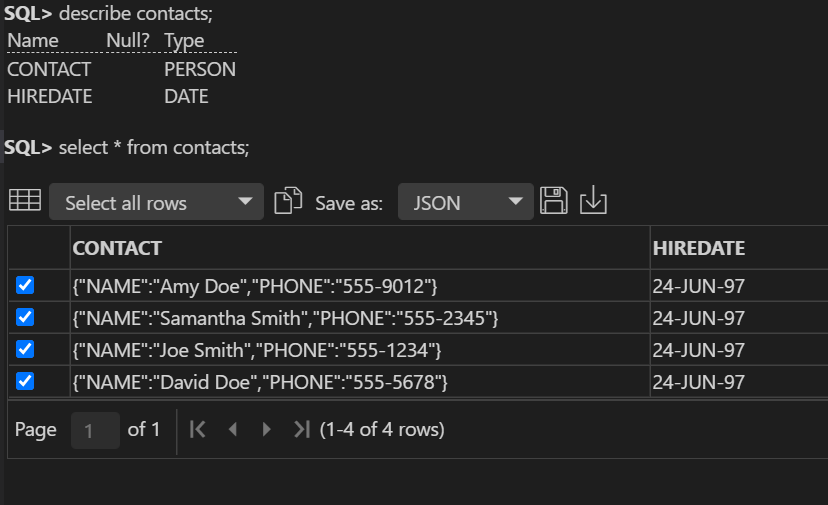
Oracle Developer Tools for VS Code 21.4 now supports User Defined Types (UDTs) in select lists, with any UDT column being displayed using JSON. This feature will be welcome news to those needing to select from tables containing Oracle Spatial types such as SDO_GEOMETRY. In the screenshot below, I am selecting from a table named CONTACTS that contains a column named CONTACT of type PERSON. The PERSON type consists of a NAME and PHONE attribute.
Support for Apple Silicon (ARM64)
Last but not least, for those of you using macOS and Apple Silicon, all you need to do is to install 21.4.0 and make sure that the .NET Runtime 6.0 is installed on your machine.
See you soon ….
This release includes additional features and bug fixes that I haven’t mentioned here. A more complete list can be found in the change log.
Please try out the 21.4.0 release of Oracle Developer Tools for VS Code and let us know what you think in our thriving community forums. I hope to see you back on these pages soon for a walkthrough of PL/SQL debugging with JDBC, Python and C# applications in Visual Studio Code.
Join the conversation!
If you’re curious about the goings-on of Oracle Developers in their natural habitat, come join us on our public Slack channel! We don’t mind being your fish bowl 🐠


No comments:
Post a Comment