Python is an integral part of machine learning and libraries make our life simpler. Recently, I came across 6 awesome libraries while working on my ML projects. They helped me save a lot of time and I am going to discuss about them in this blog.
1. clean-text
A truly incredible library, clean-text should be your go-to when you need to handle scraping or social media data. The coolest thing about it is that it doesn’t require any long fancy code or regular expressions to clean our data. Let’s see some examples:
Installation
!pip install cleantextExample
#Importing the clean text library
from cleantext import clean# Sample texttext = """ Zürich, largest city of Switzerland and capital of the canton of 633Zürich. Located in an Al\u017eupine. (https://google.com). Currency is not ₹"""# Cleaning the "text" with clean textclean(text,
      fix_unicode=True,
      to_ascii=True,
      lower=True,
      no_urls=True,
      no_numbers=True,
      no_digits=True,
      no_currency_symbols=True,
      no_punct=True,
      replace_with_punct=" ",
      replace_with_url="",
      replace_with_number="",
      replace_with_digit=" ",
      replace_with_currency_symbol="Rupees")
Output

From the above, we can see it’s having Unicode in the word Zurich (the letter ‘u’ has been encoded), ASCII characters (in Al\u017eupine.), currency symbol in rupee, HTML link, punctuations.
You just have to mention the required ASCII, Unicode, URLs, numbers, currency and punctuation in the clean function. Or, they can be replaced with replace parameters in the above function. For instance, I changed the rupee symbol into Rupees.
There’s absolutely no need to use regular expressions or long codes. Very handy library especially if you want to clean the texts from scraping or social media data. Based on your requirement, you can also pass the arguments individually rather than combining them all.
For more details, please check this GitHub repository.
2. drawdata
Drawdata is yet another cool python library finding of mine. How many times have you come across a situation where you need to explain the ML concepts to the team? It must happen often because data science is all about teamwork. This library helps you to draw a dataset in the Jupyter notebook.
Personally, I really enjoyed using this library when I explained ML concepts to my team. Kudos to the developers who created this library!
Drawdata is only for the classification problem with four classes.
Installation
!pip install drawdataExample
# Importing the drawdata
from drawdata import draw_scatterdraw_scatter()
Output

The above drawing windows will open after executing the draw_Scatter(). Clearly, there are four classes namely A, B, C, and D. You can click on any class and draw the points you want. Each class represents the different colors in the drawing. You also have an option to download the data as a csv or json file. Also, the data can be copied to you clipboard and read from the below code
#Reading the clipboardimport pandas as pd
df = pd.read_clipboard(sep=",")
df
One of the limitations of this library is that it gives only two data points with four classes. But otherwise, it is definitely worth it. For more details, please check this GitHub link.
3. Autoviz
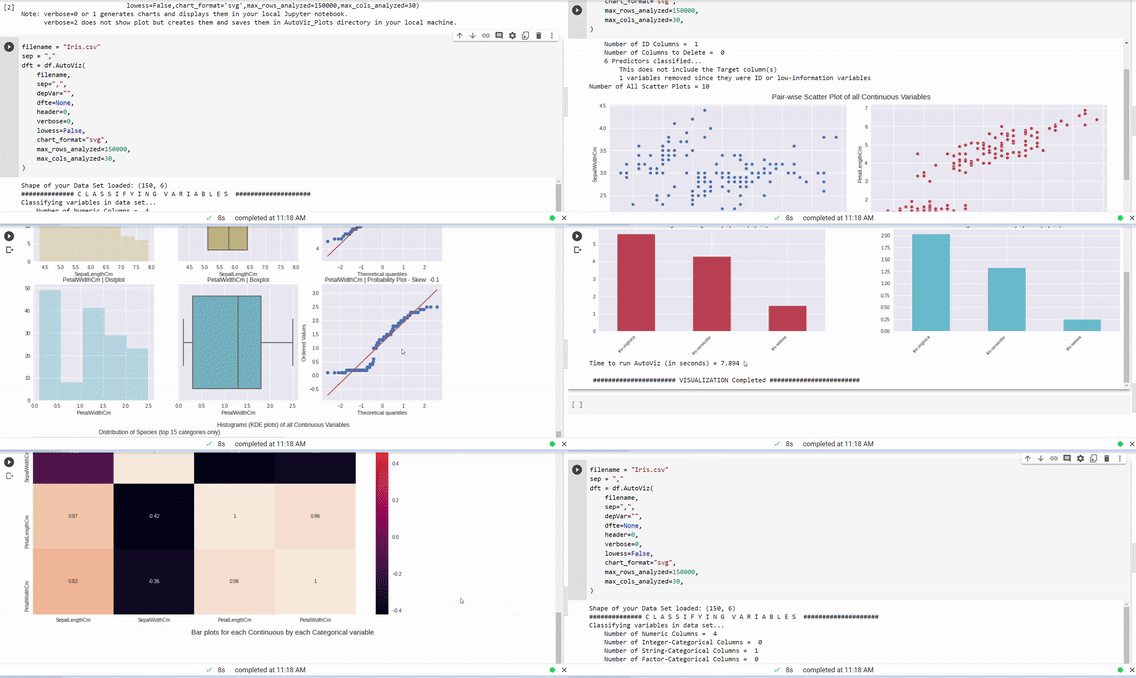
I won’t ever forget the time I spent doing exploratory data analysis using matplotlib. There are many simple visualization libraries. However, I found out recently about Autoviz which automatically visualizes any dataset with a single line of code.
Installation
!pip install autovizExample
I used the IRIS dataset for this example.
# Importing Autoviz class from the autoviz library
from autoviz.AutoViz_Class import AutoViz_Class#Initialize the Autoviz class in a object called df
df = AutoViz_Class()# Using Iris Dataset and passing to the default parametersfilename = "Iris.csv"
sep = ","graph = df.AutoViz(
    filename,
    sep=",",
    depVar="",
    dfte=None,
    header=0,
    verbose=0,
    lowess=False,
    chart_format="svg",
    max_rows_analyzed=150000,
    max_cols_analyzed=30,
)
The above parameters are default one. For more information, please check here.
Output

We can see all the visuals and complete our EDA with a single line of code. There are many auto visualization libraries but I really enjoyed familiarizing myself with this one in particular.
4. Mito
Everyone likes Excel, right? It is one of the easiest ways of exploring a dataset in a first instance. I came across Mito a few months ago, but tried it only recently and I absolutely loved it!
It is a Jupyter-lab extension python library with GUI support which adds spreadsheet functionality. You can load your csv data and edit the dataset as a spreadsheet, and it automatically generates Pandas code. Very cool.
Mito genuinely deserves an entire blog post. However, I won’t go into much detail today. Here’s a simple task demonstration for you instead. For more details, please check here.
Installation
#First install mitoinstaller in the command prompt
pip install mitoinstaller# Then, run the installer in the command prompt
python -m mitoinstaller install# Then, launch Jupyter lab or jupyter notebook from the command prompt
python -m jupyter lab
For more information on installation, please check here.
# Importing mitosheet and ruuning this in Jupyter labimport mitosheet
mitosheet.sheet()
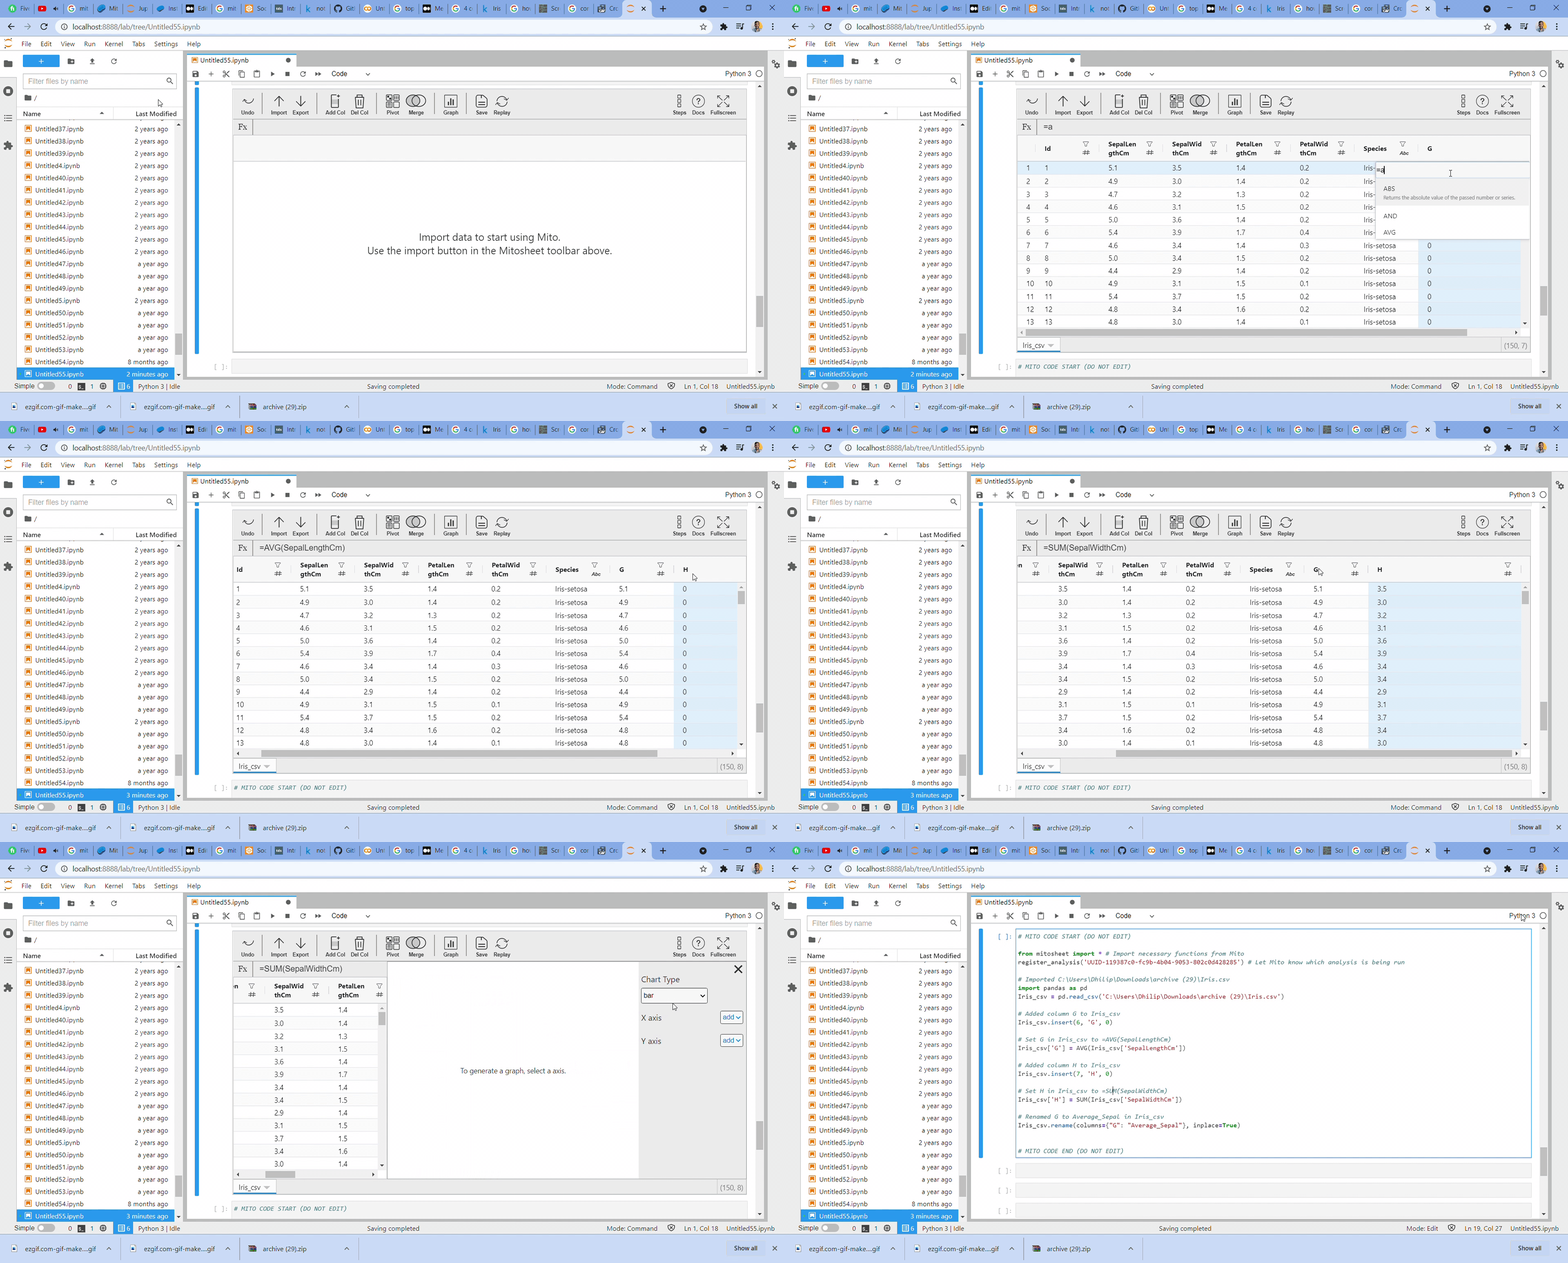
After executing the above code, mitosheet will open in the jupyter lab. I’m using the IRIS dataset. Firstly, I created two new columns. One is average Sepal length and the other is sum Sepal width. Secondly, I changed the column name for average Sepal length. Finally, I created a histogram for the average Sepal length column.
The code is automatically generated after the above mentioned steps are followed.
Output

Below code was generated for the above steps:
from mitosheet import * # Import necessary functions from Mito
register_analysis('UUID-119387c0-fc9b-4b04-9053-802c0d428285') # Let Mito know which analysis is being run# Imported C:\Users\Dhilip\Downloads\archive (29)\Iris.csv
import pandas as pd
Iris_csv = pd.read_csv('C:\Users\Dhilip\Downloads\archive (29)\Iris.csv')# Added column G to Iris_csv
Iris_csv.insert(6, 'G', 0)# Set G in Iris_csv to =AVG(SepalLengthCm)
Iris_csv['G'] = AVG(Iris_csv['SepalLengthCm'])# Renamed G to Avg_Sepal in Iris_csv
Iris_csv.rename(columns={"G": "Avg_Sepal"}, inplace=True)
5. Gramformer
Yet another impressive library, Gramformer is based on generative models which help us correct the grammar in the sentences. This library has three models which have a detector, a highlighter, and a corrector. The detector identifies if the text has incorrect grammar. The highlighter marks the faulty parts of speech and the corrector fixes the errors. Gramformer is a completely open source and is in its early stages. But it isn’t suitable for long paragraphs as it works only at a sentence level and has been trained for 64 length sentences.
Currently, the corrector and highlighter model works. Let’s see some examples.
Installation
!pip3 install -U git+https://github.com/PrithivirajDamodaran/Gramformer.gitInstantiate Gramformer
gf = Gramformer(models = 1, use_gpu = False) # 1=corrector, 2=detector (presently model 1 is working, 2 has not implemented)
Example
#Giving sample text for correction under gf.correctgf.correct(""" New Zealand is island countrys in southwestern Paciific Ocaen. Country population was 5 million """)
Output

From the above output, we can see it corrects grammar and even spelling mistakes. A really amazing library and functions very well too. I have not tried highlighter here, you can try and check this GitHub documentation for more details.
6. Styleformer
My positive experience with Gramformer encouraged me to look for more unique libraries. That is how I found Styleformer, another highly appealing Python library. Both Gramformer and Styleformer were created by Prithiviraj Damodaran and both are based on generative models. Kudos to the creator for open sourcing it.
Styleformer helps convert casual to formal sentences, formal to casual sentences, active to passive, and passive to active sentences.
Let’s see some examples
Installation
!pip install git+https://github.com/PrithivirajDamodaran/Styleformer.gitInstantiate Styleformer
sf = Styleformer(style = 0)# style = [0=Casual to Formal, 1=Formal to Casual, 2=Active to Passive, 3=Passive to Active etc..]
Examples
# Converting casual to formal sf.transfer("I gotta go")

# Formal to casual
sf = Styleformer(style = 1)     # 1 -> Formal to casual# Converting formal to casual
sf.transfer("Please leave this place")

# Active to Passive
sf = Styleformer(style = 2)     # 2-> Active to Passive# Converting active to passive
sf.transfer("We are going to watch a movie tonight.")

# passive to active
sf = Styleformer(style = 2)     # 2-> Active to Passive# Converting passive to active
sf.transfer("Tenants are protected by leases")

See the above output, it converts accurately. I used this library for converting casual to formal, especially for social media posts in one of my analyses. For more details, kindly check GitHub.
You might be familiar with some of the previously mentioned libraries but ones like Gramformer and Styleformer are recent players. They are extremely underrated and most certainly deserve to be known because they saved a lot of my time and I heavily used them for my NLP projects.
Thanks for reading. If you have anything to add, please feel free to leave a comment!
You might also like my previous article Five Cool Python Libraries for Data Science
Data Scientist | Business Intelligence Analyst https://www.linkedin.com/in/dhilip-subramanian-36021918b/
Sign up for The Variable
By Towards Data Science
Every Thursday, the Variable delivers the very best of Towards Data Science: from hands-on tutorials and cutting-edge research to original features you don't want to miss. Take a look.
Your home for data science. A Medium publication sharing concepts, ideas and codes.
TIME SERIES FROM SCRATCH
Part 3 of the Time Series from Scratch Series — Learn everything about white noise and random walks, and their importance in time series forecasting

Forecasting time series data can be a challenging task. Before you even start, ask yourself the following question — Is it worth it? Well, if your data looks like white noise or random walk, the answer is simple — no.
Today you’ll learn the ideas behind these two essential topics in time series analysis. We’ll go over some theory and look at the implementation in Python.
The article is structured as follows:
- White Noise: Theory and Implementation
- Random Walk: Theory and Implementation
- Conclusion
White Noise: Theory and Implementation
The concept of white noise is essential for time series analysis and forecasting. In the most simple…
Post a quick thought or a long story. It's easy and free.
HANDS-ON DATA ANALYTICS WITH PYTHON
Explained with Example — .astype(), .convert_dtypes() and.to_numeric()
Working with data is rarely straightforward.
Mostly one needs to perform various transformations on the imported dataset, to make it easy to analyze.
In all of my projects, pandas never detect the correct data type for all the columns of the imported dataset. But at the same time, Pandas offer a range of methods to easily convert the column data types.
Here, you will get all the methods for changing the data type of one or more columns in Pandas and certainly the comparison amongst them.
Throughout the read, the resources are indicated with 📚, the shortcuts are indicated ⚡️…


No comments:
Post a Comment