Wednesday, February 2, 2022

How to Self-Learn Data Science in 2022


As someone who don’t hold a degree in data science, I am truly passionate about this field and decided to experiment on building my own curriculum to learn data science in spare time. I would like to share my experience and hope to bring some insights if you want to share the same journey.

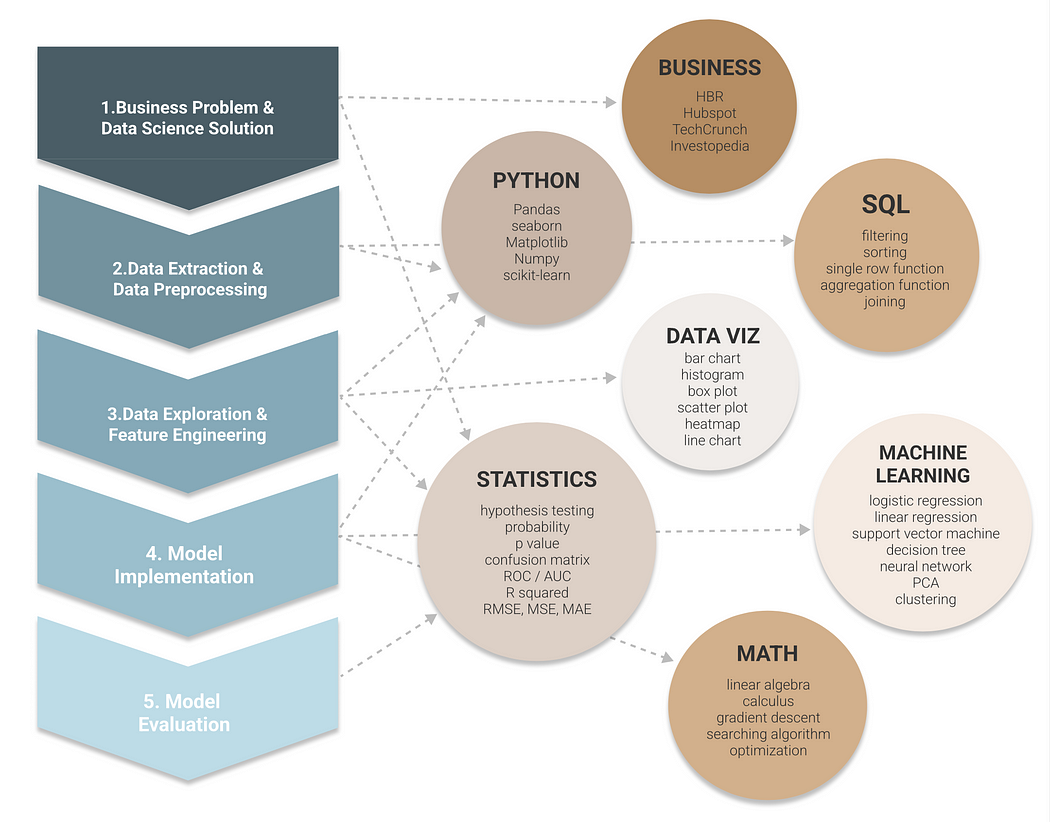
Project-based learning is a good starting point for people already have some technical background, but also want to dive deeper into the building blocks of data science. A typical data science/machine learning project comprises the lifecycle — from defining the objectives, data preprocessing, exploratory data analysis, feature engineering, model implementation to model evaluation. Each phase requires different skillsets, including statistics, programming, SQL, data visualization, mathematics and business knowledge.

I highly recommend Kaggle as the platform to experiment with your data science projects and Medium as the platform to gain data science knowledge from professionals. With plenty of interesting datasets and a cloud based programming environment, you can easily get data source, code and notebooks from Kaggle for free. While several popular data science publications (e.g. Towards Data ScienceAnalytics Vidhya) from Medium allows you to learn from others work and share your own projects all at the same place. If you’d like to read more articles from Medium and also support my work, I really appreciate you signing up using this affiliate link.

Why Project Based Approach?

  1. It is practical and gives us a sense of achievement that we are doing something real!
  2. It highlights the rationale of learning each pieces of content. A goal-oriented approach provides a bird eye view of how each little pieces tie together to form the big picture.
  3. It allow us to actively retrieve the information as we are learning. “Active Recall” is proven to significantly enhance information retention, compared to conventional learning mechanism which only requires passively consuming knowledge.

Let’s break down the data science lifecycle into following 5 steps and we will see how each step connects to various knowledge domains.

1.Business Problem & Data Science Solution

The first step of a data science project is to identify the business problem and define the objectives of an experiment design or model deployment.

Skillset — Business Knowledge

At this stage, it doesn’t need technicals skill yet but demands business understanding to identify the problem and define the objectives. First to understand the domain specific terminology appeared in the dataset, then to translate a business requirement to a technical solution. It requires years of experience in the field to build up your knowledge. Here I can only recommend some websites that increase your exposure to some business domains, for example Harvard Business ReviewHubspotInvestopediaTechCrunch.

Skillset — Statistics (Experiment Design)

After defining the problem, then it is to frame it into a data science solution. This starts with the knowledge in Experiment Design such as:

  • hypothesis testing
  • sampling
  • bias / variances
  • different types of errors
  • overfitting / underfitting.

There are various type of hypothesis testing to explore — T test, ANOVA, Chi Square test …. Machine Learning is fundamentally considered as a hypothesis testing process, where we need to search for a model in the hypothesis space that best fits our observed data, and allows us to make prediction to unobserved data.

Useful Resource:

2. Data Extraction & Data Preprocessing

The second step is to collect data from various sources and transform the raw data into digestible format.

Skillset — SQL

SQL is a powerful language for communicating with and extracting data from structured database. Learning SQL also assists with framing a mental model that helps you to generate insights through data querying techniques, such as grouping, filtering, sorting, and joining. You will also find similar logics appearing in other languages, such as Pandas and SAS.

Useful Resources:

Skillset — Python (Pandas)

It is essential to get comfortable with a programing language while learning data science. The simple syntax makes Python a relatively easy language to start with. Here is a great video tutorial if you are new to Python: Python for Beginners — Learn Python in 1 Hour.

After a basic understanding, it’s worth spending some time to learn Pandas library. Pandas is almost unavoidable if you use python for data extraction. It transforms database into dataframe — a table like format that we are most familiar with. Pandas also plays an important role in data preprocessing, when it is required to examine and handle following data quality issues,.

  • address missing data
  • transform inconsistent data type
  • remove duplicated value

Useful Resources:

3. Data Exploration & Feature Engineering

The third step is data exploration, also known as EDA (exploratory data analysis) which reveals hidden characteristics and patterns in a dataset. It is usually achieved by data visualization, and followed by feature engineering to transform data based on the outcome of data exploration.

Skillset — Statistics (Descriptive Statistics)

Data exploration use descriptive statistics to summarize characteristics of the dataset:

  • mean, median, mode
  • range, variance, standard deviation
  • correlation, covariance
  • skewness, distribution

After a solid understanding of the dataset characteristics, we need to apply the most appropriate feature engineering techniques accordingly. For instance, use log transformation for right-skewed data and clipping methods to deal with outliers. Here I list down some common feature engineering techniques:

  • categorical encoding
  • scaling
  • log transformation
  • imputation
  • feature selection

Useful Resource:

Skillset — Data Visualization

Combining statistics and data visualization allows us to understand the data through appropriate visual representation. Whether you prefer using visualization package such as seaborn or matplotlib in Python and ggplot2 in R; or visualization tools like Tableau and PowerBI, it’s essential to distinguish the use case of common chart types:

  • bar chart
  • histogram
  • box plot
  • heatmap
  • scatter plot
  • line chart

If interested, please check out my articles on EDA and data visualization:

4. Model Implementation

After all of the preparation so far, it’s finally the time to dive deeper into machine learning algorithms.

Skillset — Machine Learning

scikit-learn is a powerful Python library that allows beginners to get started in machine learning easily. It offers plenty of built-in package and we can easily implement a model using several lines of code. Although it has already done the hard work for us, it is still crucial to understanding how the algorithms operate behind the scene and be able to distinguish the best use case for each. Generally, machine learning algorithms are categorized into supervised learning and unsupervised learning. Below are some of the most popular algorithms:

Supervised Learning:

Unsupervised Learning:

I have created practical guides for some machine learning algorithms. If you are interested, check out my lists on these topics.

Practical Guides to Machine Learning

5 stories

Useful Resources:

Skillset — Math

Many starters including me may have the question of why we need to learn Math in data science.

As a beginner, math knowledge mainly assists in understanding the underlying theory behind the algorithms. Moving forward, when we no longer rely on built in libraries for machine learning models, it allows us to develop and optimize customized algorithms. Additionally, hyperparameter tuning also requires advanced math knowledge for searching the best model that minimize the cost function.

This is when more complicated math topics come into place:

  • calculus
  • linear algebra
  • optimization problem
  • gradient descent
  • searching algorithms

Useful Resources:

5. Model Evaluation

Skillset — Statistics (Inferential Statistics)

Inferential Statistics is particular useful when making model prediction and evaluating model performance. As opposed to descriptive statistics, inferential statistics focuses on generalizing the pattern observed in the sample data to a wider population. It provides evidence of which features have high importance in making inference. Also it determines the model performance based on evaluation metrics.

For example, for classification problem where the output are discrete categories, some common metrics are:

  • Confusion matrix
  • Type 1 error / Type 2 error
  • Accuracy
  • ROC / AUC

Whereas, for regression problem where the output are continuous numbers, some common metrics are:

  • R Squared
  • Root Mean Squared Error (RMSE), Mean Absolute Error (MAE), Mean Squared Error (MSE)

Useful Resources

Take-Home Message

It is a general guide that documents the learning journey I followed through, so I hope this can help some starters that are also passionate about data science and would like to invest their spare time exploring this field. Most topics I mentioned in the article are at surface level, and allows you to choose a field to dig deeper based on your own preference. If you find it helpful and would like to read more articles like this, please support by signing up Medium Membership.

Wednesday, January 26, 2022

Apache Spark — Multi-part Series: What is Apache Spark?

 The main driving goal of Apache Spark is to enable users to build big data applications via a unified platform in an accessible and familiar way. Spark is designed in such a way that traditional data engineers and analytical developers will be able to integrate their current skill sets, whether that be coding languages or data structures with ease.

But what does that all mean and you still haven’t answered the question!

https://www.datanami.com/2019/03/08/a-decade-later-apache-spark-still-going-strong/

Apache Spark is a computing engine which contains multiple API’s (Application Programming Interfaces), these API’s allow a user to interact using traditional methods with the back-end Spark engine. One key aspect of Apache Spark is that it does not store data for a long period of time. Data can be notoriously expensive to move from one location to another so Apache Spark utilises its compute functionality over the data, wherever it resides. Within the Apache Spark user interfaces, Spark tries to ensure that each storage system looks reasonably similar so that applications do not need to worry about where their data is stored.

This compute engine allows a user to create an end to end solution which utilises the distributed capabilities of multiple machines all working towards a common goal. This could be large scale aggregations, machine learning on large data sets or even streaming of data with massive throughput. Most of these problems are commonly reffered to as “Big Data”.

Why is Big Data a Problem?

Big data has many definitions, but one that stuck with me is:

If data is too big to fit onto your device, it’s Big Data!

The term “big data” has been around for many, many years. So being able to do analysis on this data has been a challenge, almost since computing began! There have been many engines and systems built to help manage big data and they all utilise different methods to increase speed, efficiency and reliability. Parallel compute was one of these developments. As technology advances, the rate at which data is being collected is increasing exponentially, it is also becoming progressively cheaper to collect data. Many institutions are collecting data for the sake of collection and logging, so, being able to answer business critical questions from this data was, and still is becoming more and more expensive with the ageing compute engines that were available before Apache Spark.

Spark was developed to tackle some of the world’s largest big data problems, from simple data manipulation all the way through to deep learning.

Who Created it?

Spark was initially started by Matei Zaharia at UC Berkeley’s AMPLab in 2009, and open sourced in 2010 under a BSD license.

In 2013, the project was donated to the Apache Software Foundation and switched its license to Apache 2.0. In February 2014, Spark became a Top-Level Apache Project.

In November 2014, Spark founder M. Zaharia’s company Databricks set a new world record in large scale sorting using Spark.

Spark had in excess of 1000 contributors in 2015, making it one of the most active projects in the Apache Software Foundation and one of the most active open source big data projects.

https://en.wikipedia.org/wiki/Apache_Spark

Spark Libraries:

There are a multitude of libraries available in Apache Spark, many of which are developed directly by the Spark community. These libraries include but are not limited to:

  • MLlib
  • Spark Streaming
  • GraphX

These libraries have been developed in such a way that they are interpretable, meaning they enable the writing of end-to-end solutions in the same engine environment for the first time.

Spark Language Capabilities:

Spark has the capabilities to allow the user to write code in Python, Java, Scala R or SQL, but languages such as Python, and R require the user to install an instance of their relevant interpreter. All Python, R, Scala and SQL are compiled down into Java. This is because the code you write runs inside of a JVM (Java Virtual Machine). So regardless of where you run your Spark instance, all you need is an installation of Java.

Apache Spark can be run in a multitude of ways. Locally is quite common for general development use and for hobbyists, however, in production most instances are developed in a cloud environment. An example of this would be to use AWS EMR to manage node (driver and worker) instances, Azure HDInsight or to use an online notebook experience in the form of Databricks.

Whether Spark is run locally or in a cloud environment the user is able to access the different interactive shells available via a console or terminal. These come in the form of:

  • Python Console
  • Scala Console
  • SQL Console

However one difference is the Databricks notebook environment, which is a similar experience to the user interface provided by Jupyter. The Databricks environment provides plenty of extra functionality built into the platform which allows the user to maximise their productivity, by having access to all these features in one place.

Latest Spark Release:

The latest Spark release can be found here:

Finally

This section is quite lightweight in regards to depth, but, it lays out some scope for the sections to come. These further sections will dive deeper into each aspect, such as, architecture, libraries and data structures.

The next section will cover an in-depth look into how Apache Spark runs on a cluster and how the physical architecture works alongside the runtime architecture.

Apache Spark — Multi-part Series: Spark Architecture

 Spark Architecture was one of the toughest elements to grasp when initially learning about Spark. I think one of the main reasons is that there is a vast amount of information out there, but nothing which gives insight into all aspects of the Spark Ecosystem. This is most likely because, its complicated! There are so many fantastic resources out there, but not all are intuitive or easy to follow.

I am hoping this part of the series will help people who have very little knowledge of the topic understand how Spark Architecture is built, from the foundations up. We will also investigate how we can provide our Spark system with work and how that work is consumed and completed by the system in the most efficient way possible.

As promised, this section is going to be a little more heavy. So buckle yourself in, this is going to be fun!

Physical Spark Hierarchy:

To understand how Spark programs work, we need to understand how a Spark system is built, brick by brick (see what I did there). There are a number of different ways to set up a Spark system, but for this part in the series we will discuss one of the most popular ways to set it up.

Generally, a Spark system is built using a number of separate machines who all work together towards a common goal, this is referred to as a cluster or distributed system. For a system like this to work, we need to have a machine which manages the cluster as a whole. This machine is usually labelled as the driver node.

Driver Node

The Spark driver is used to orchestrate the whole Spark cluster, this means it will manage the work which is distributed across the cluster as well as what machines are available throughout the cluster lifetime.

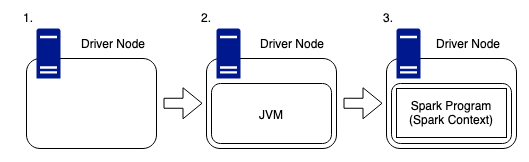
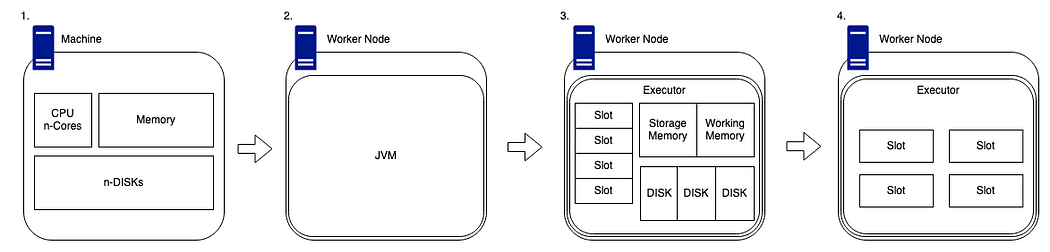
Driver Node Step by Step (created by Luke Thorp)
  1. The driver node is like any other machine, it has hardware such as a CPU, memory, DISKs and a cache, however, these hardware components are used to host the Spark Program and manage the wider cluster. The driver is the users link, between themselves, and the physical compute required to complete any work submitted to the cluster.
  2. As Spark is written in Scala, it is important to remember that any machine within the cluster needs to have a JVM (Java Virtual Machine) running, so that Spark can work with the hardware on the host.
  3. The Spark Program runs inside of this JVM and is used to create the SparkContext, which is the access point for the user to the Spark Cluster.

The driver contains the DAG (Directed Acyclic Graph) scheduler, task scheduler, backend scheduler and the block manager. These driver components are responsible for translating user code into Spark jobs executed on the cluster. Hidden away within the driver node is the cluster manager, which is responsible for acquiring resources on the Spark cluster and allocating them to a Spark job. These resources come in the form of worker nodes.

Worker Node(s)

Worker nodes form the “distributed” part of the cluster. These nodes come in all shapes and sizes and don’t always have to be the same to join a cluster, they can vary in size and performance. Although, having worker nodes which perform equally, can be a benefit when investigating performance bottlenecks further down the line. So, it’s something to bear in mind.

Worker Node Step by Step (created by Luke Thorp)
  1. Worker nodes are generally stand-alone machines which have hardware like any other. Such as a CPU, memory, disks and a cache.
  2. As with the driver, for Spark to run on a worker node, we need to ensure that the system has a compatible version of Java installed so that the code can be interpreted in the correct and meaningful way.
  3. When we have Spark installed on our worker node, our driver node will be able to utilise its cluster management capabilities to map what hardware is available on the worker.
    The cluster manager will track the number of “slots”, which are essentially the number of cores available on the device. These slots are classified as available chucks of compute and they can be provided tasks to complete by the driver node.
    There is an amount of available memory which is split into two sections, storage memory and working memory. The default ratio of this is 50:50, but this can be changed in the Spark config.
    Each worker also has a number of disks attached. But I know what you are going to say, Spark works in memory, not disk! However, Spark still needs disks to allocate shuffle partitions (discussed further, later in this article), it also needs space for persistence to disk and also spill to disk.
  4. Now we have the details of how Driver nodes and Worker nodes are structured, we need to know how that interact and deal with work.
    For this we will create a minimalist version of the diagram to show a worker node and its available slots for work.

Minimised Physical Structure

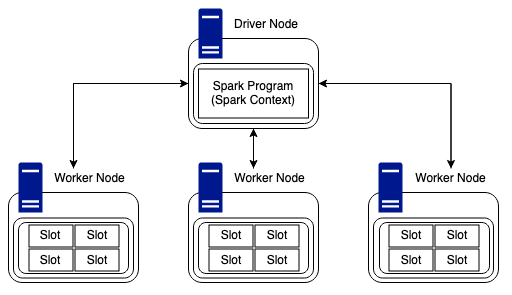
Now that we know how the Driver and Workers are structured independently, we can look into how they are intrinsically linked within the context of a cluster. As stated above we will simplify the view of the worker node, such that it shows only the elements that are important for the next section. (They still have memory and disks!)

Looking at the Driver and Worker nodes we can see that the Driver node is the central hub for communication between nodes in the cluster.

Driver Node and Worker Node Architecture (created by Luke Thorp)

Worker nodes are able to communicate and pass data between each other but in regards to work and tasks, the Driver node is solely responsible for providing Workers with jobs to complete.

With the example above, we have a cluster containing a driver, and three worker nodes. Each node has four slots of compute available, so, this cluster would be able to complete twelve tasks in unison. It is worth mentioning that Sparks new photon engine is a Spark compatible vectorised query engine which has been developed to meet and take advantage of the latest CPU architecture. This enables faster parallel processing of data and even live performance improvements as data is read during task execution.

Spark Runtime Architecture

The Spark runtime architecture is exactly what it says on the tin, what happens to the cluster at the moment of code being run. Well, “code being run” might be the wrong phase. Spark has both eager and lazy evaluation. Spark actions are eager; however, transformations are lazy by nature.

As stated above, transformations are lazy, this essentially means when we call some operation on our data, it does not execute immediately. Spark maintains the record of which operation is being called. These operations can include joins and filters.

Actions are eager, which means that when an action is called, the cluster will start to compute the expected results as soon as the line of code is run. When Actions are run, they result in a non-RDD (resilient distributed dataset) component.

Types of Transformations:

There are two types of transformations which are key to understanding how Spark manages data and computes in a distributed manner, these are narrow and wide. Transformations create RDDs from each other.

Narrow and Wide Transformations (created by Luke Thorp)
  • Narrow Transformations are defined by one input partition will result in one output partition. An example of this could be a filter: as we can have a data frame of data which we can filter down to a smaller dataset without the need to understand any data held on any other worker node.
  • Wide transformations (shuffles) are defined by the fact the worker nodes will need to transfer (shuffle) data across the network to complete the required task. An example of this could be a join: as we may need to collect data from across the cluster to complete a join of two datasets fully and correctly.
Wide Transformations Extended (created by Luke Thorp)

Wide transformations can take many forms, and n input partitions may not always results in n output partitions. As stated above, joins are classed as wide transformations. So in the instance above, we have two RDD’s which have varying number of partitions being joined together to form a new RDD.

Runtime

When the user submits code to the driver via their preferred method, the driver implicitly converts the code containing transformations (filters, joins, groupby, unions, etc) and actions (counts, writes, etc) into an unresolved logical plan.

At the submission stage, the driver refers to the logical plan catalog to ensure all code conforms to the required parameters, after this is complete the unresolved logical plan is tranformed into a logical plan. The process now performs optimisations, like planning transformations and actions, this optimiser is better know as the catalyst optimiser.

At the core of Spark SQL is the Catalyst optimizer, which leverages advanced programming language features (e.g. Scala’s pattern matching and quasi quotes) in a novel way to build an extensible query optimizer. Catalyst is based on functional programming constructs in Scala and designed with these key two purposes:

- Easily add new optimization techniques and features to Spark SQL

- Enable external developers to extend the optimizer (e.g. adding data source specific rules, support for new data types, etc.)

https://databricks.com/glossary/catalyst-optimizer

Apache Spark Catalyst Optimiser: Databricks (https://databricks.com/glossary/catalyst-optimizer)

I will be doing a deep dive into the catalyst optimiser in the next part of the series, so don’t worry about that part too much.

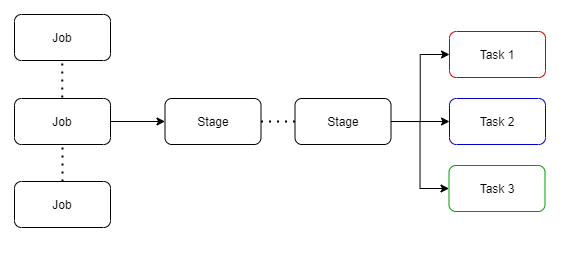
Once the optimisations are complete, the logical plan is converted into multiple physical execution plans, these plans are funnelled into a cost model with analyses each plan and applies a cost value to run each execution plan. The plan with the lowest cost to complete will be selected as the final output. This selected execution plan will contain job(s) with multiple stages.

Physical Execution Plan (created by Luke Thorp)

Stages have small physical called tasks which are bundled to be sent to the Spark cluster. Before these tasks are distributed, the driver program talks to the cluster manager to negotiate for resources.

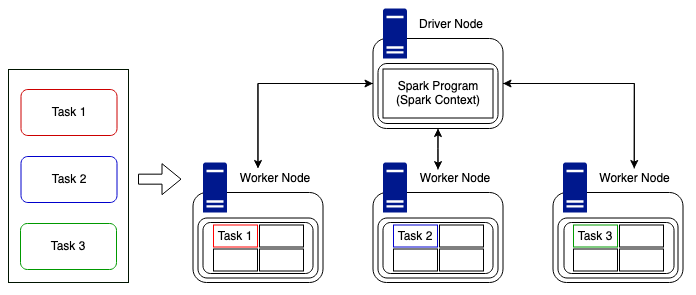
Cluster Task Assignment (created by Luke Thorp)

Once this is done and resources have been allocated, tasks are distributed to the worker nodes (executors) who have free time, and the driver program monitors the progress. This is done in the most efficient way possible keeping in mind the current available resources and the cluster structure. In the above example it is simple, we have three tasks to distribute to three worker nodes. Tasks could be distributed in the way above, i.e. one task to each worker node, or they could be sent to one node and still run asynchronously due to the parallel nature of Spark. But complexity arises when we have more tasks than available slots of compute, or when we have a non uniformly divisible number of tasks compared to that of the nodes in the cluster. Luckily for us, Spark deals with this itself and manages the task distribution.

It is worth mentioning, although Spark can distribute tasks in and efficient way, it cannot always interpret the data, meaning, we could encounter data skew which can cause vast time differences in task duration. However, this all depends on how the underlying data lake is structured. If it is built using Delta Engine (Photon) we can take advantage of the live improvement to query execution as well as improvements which encourage better shuffle sizes and optimal join types.

The Spark UI (user interface) allows the user to interogate the entire workload process, meaning the user can dive into each part. For example, there are tabs for Jobs and Stages. By moving into a stage the user can look at metrics related to specific tasks, this method can be used to understand why specific jobs may be taking longer than expected to complete.

Cloud vs Local

As I am sure you have guessed, Spark clusters are generally built within a cloud environment using popular services from cloud service providers. This is done due to the scalability, reliability and cost effectiveness of these services. However, you may not be aware that you can run Spark on your local machine if you want to play around with the Spark config.

By far the easiest option for tinkering, is to sign up to the community edition of Databricks. This allows you to create a small but reasonably powerful single worker node cluster with the capability to run all of the Databricks code examples and notebooks. If you haven’t done it already… do it! There are limitations and the clusters do timeout after two hours of idle time, but free compute is free compute!

Finally

Spark Architecture is hard. It takes time to understand the physical elements, and how the core runtime code translates into data being transformed and moving around a cluster. As we work through the series, we will continue to refer back to this section to ensure we all have the fundamentals locked into our grey matter.

For this series, I will be looking into ways that we will be able to dive even deeper into the depths of Spark such that we can understand the bare bones of the JVM structurre and how the optimisers function on our unresolved logical plans.

It is worth noting that there will be an upcoming section, where we will be building a Spark cluster using a Raspberry Pi as the Driver node, and a number of Raspberry Pi Zero’s as the Worker Nodes. I just need to wait for the items to be delivered… Covid delivery times are slow!

If I have missed anything from this section, or if something still isn’t clear, please let me know so that I can improve this series and not to mention my Spark knowledge! You can find me on LinkedIn:

Series Sections:

Introduction

  1. What is Apache Spark
  2. Spark Architecture

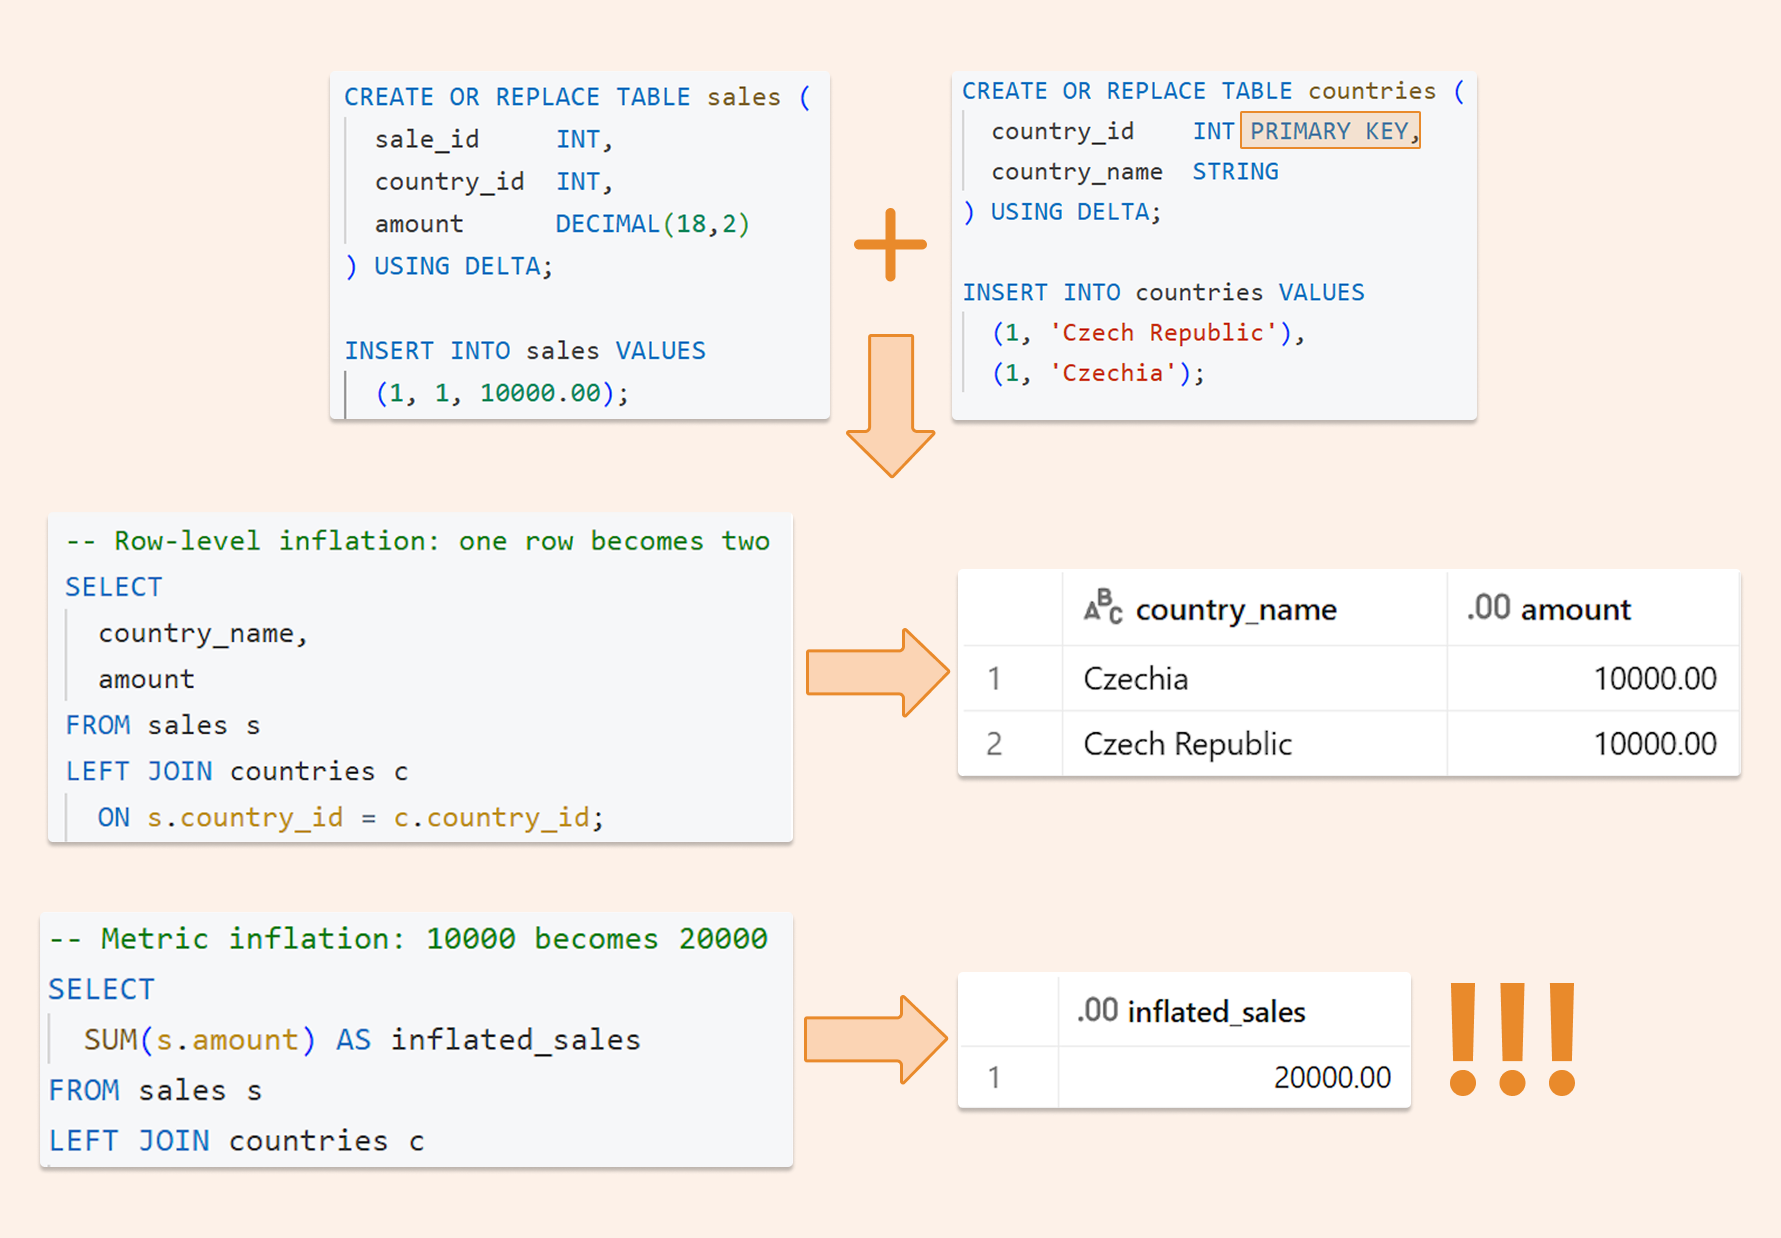
Deduplicating Data on the Databricks Lakehouse: Making joins, BI, and AI queries “safe by default.”

  Imagine this: your manager asks the AI analytics tool: "What were our top-selling products last quarter?" The AI generates perfe...