As someone who don’t hold a degree in data science, I am truly passionate about this field and decided to experiment on building my own curriculum to learn data science in spare time. I would like to share my experience and hope to bring some insights if you want to share the same journey.
Project-based learning is a good starting point for people already have some technical background, but also want to dive deeper into the building blocks of data science. A typical data science/machine learning project comprises the lifecycle — from defining the objectives, data preprocessing, exploratory data analysis, feature engineering, model implementation to model evaluation. Each phase requires different skillsets, including statistics, programming, SQL, data visualization, mathematics and business knowledge.
I highly recommend Kaggle as the platform to experiment with your data science projects and Medium as the platform to gain data science knowledge from professionals. With plenty of interesting datasets and a cloud based programming environment, you can easily get data source, code and notebooks from Kaggle for free. While several popular data science publications (e.g. Towards Data Science, Analytics Vidhya) from Medium allows you to learn from others work and share your own projects all at the same place. If you’d like to read more articles from Medium and also support my work, I really appreciate you signing up using this affiliate link.
Why Project Based Approach?
- It is practical and gives us a sense of achievement that we are doing something real!
- It highlights the rationale of learning each pieces of content. A goal-oriented approach provides a bird eye view of how each little pieces tie together to form the big picture.
- It allow us to actively retrieve the information as we are learning. “Active Recall” is proven to significantly enhance information retention, compared to conventional learning mechanism which only requires passively consuming knowledge.
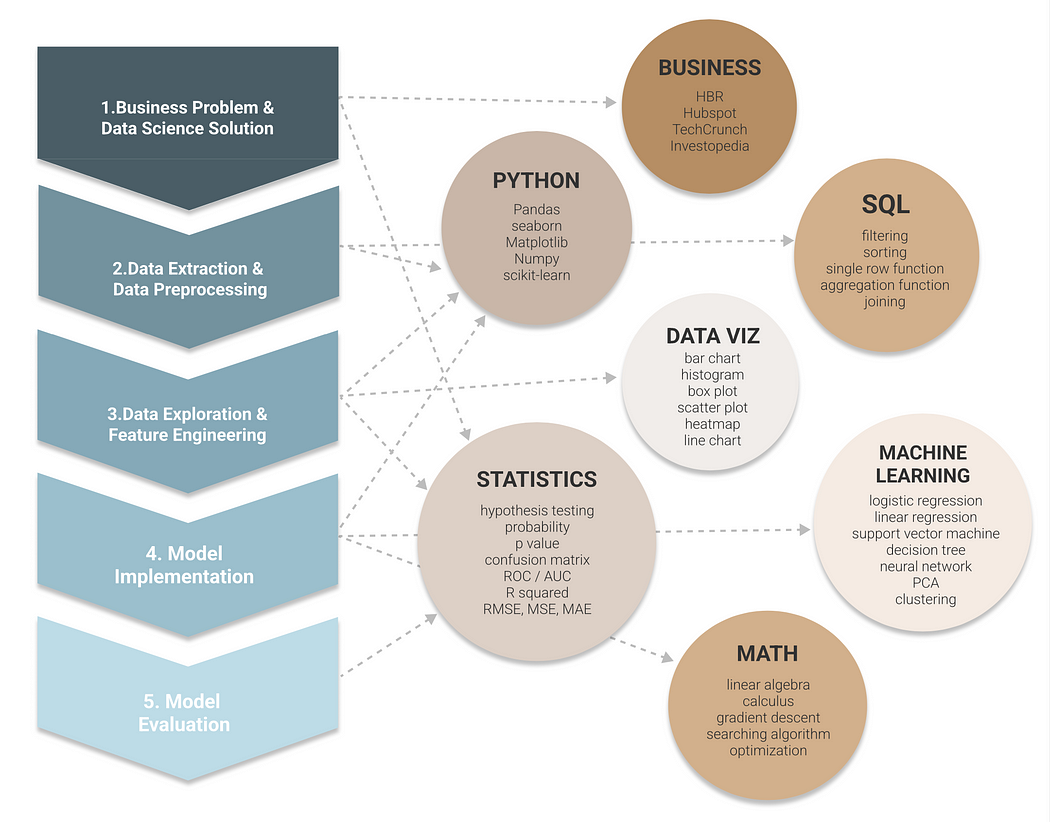
Let’s break down the data science lifecycle into following 5 steps and we will see how each step connects to various knowledge domains.
1.Business Problem & Data Science Solution
The first step of a data science project is to identify the business problem and define the objectives of an experiment design or model deployment.
Skillset — Business Knowledge
At this stage, it doesn’t need technicals skill yet but demands business understanding to identify the problem and define the objectives. First to understand the domain specific terminology appeared in the dataset, then to translate a business requirement to a technical solution. It requires years of experience in the field to build up your knowledge. Here I can only recommend some websites that increase your exposure to some business domains, for example Harvard Business Review, Hubspot, Investopedia, TechCrunch.
Skillset — Statistics (Experiment Design)
After defining the problem, then it is to frame it into a data science solution. This starts with the knowledge in Experiment Design such as:
- hypothesis testing
- sampling
- bias / variances
- different types of errors
- overfitting / underfitting.
There are various type of hypothesis testing to explore — T test, ANOVA, Chi Square test …. Machine Learning is fundamentally considered as a hypothesis testing process, where we need to search for a model in the hypothesis space that best fits our observed data, and allows us to make prediction to unobserved data.
Useful Resource:
2. Data Extraction & Data Preprocessing
The second step is to collect data from various sources and transform the raw data into digestible format.
Skillset — SQL
SQL is a powerful language for communicating with and extracting data from structured database. Learning SQL also assists with framing a mental model that helps you to generate insights through data querying techniques, such as grouping, filtering, sorting, and joining. You will also find similar logics appearing in other languages, such as Pandas and SAS.
Useful Resources:
Skillset — Python (Pandas)
It is essential to get comfortable with a programing language while learning data science. The simple syntax makes Python a relatively easy language to start with. Here is a great video tutorial if you are new to Python: Python for Beginners — Learn Python in 1 Hour.
After a basic understanding, it’s worth spending some time to learn Pandas library. Pandas is almost unavoidable if you use python for data extraction. It transforms database into dataframe — a table like format that we are most familiar with. Pandas also plays an important role in data preprocessing, when it is required to examine and handle following data quality issues,.
- address missing data
- transform inconsistent data type
- remove duplicated value
Useful Resources:
3. Data Exploration & Feature Engineering
The third step is data exploration, also known as EDA (exploratory data analysis) which reveals hidden characteristics and patterns in a dataset. It is usually achieved by data visualization, and followed by feature engineering to transform data based on the outcome of data exploration.
Skillset — Statistics (Descriptive Statistics)
Data exploration use descriptive statistics to summarize characteristics of the dataset:
- mean, median, mode
- range, variance, standard deviation
- correlation, covariance
- skewness, distribution
After a solid understanding of the dataset characteristics, we need to apply the most appropriate feature engineering techniques accordingly. For instance, use log transformation for right-skewed data and clipping methods to deal with outliers. Here I list down some common feature engineering techniques:
- categorical encoding
- scaling
- log transformation
- imputation
- feature selection
Useful Resource:
- 3 Common Techniques for Data Transformation
- Fundamental Techniques of Feature Engineering for Machine Learning
- Feature Selection and EDA in Machine Learning
Skillset — Data Visualization
Combining statistics and data visualization allows us to understand the data through appropriate visual representation. Whether you prefer using visualization package such as seaborn or matplotlib in Python and ggplot2 in R; or visualization tools like Tableau and PowerBI, it’s essential to distinguish the use case of common chart types:
- bar chart
- histogram
- box plot
- heatmap
- scatter plot
- line chart
If interested, please check out my articles on EDA and data visualization:
4. Model Implementation
After all of the preparation so far, it’s finally the time to dive deeper into machine learning algorithms.
Skillset — Machine Learning
scikit-learn is a powerful Python library that allows beginners to get started in machine learning easily. It offers plenty of built-in package and we can easily implement a model using several lines of code. Although it has already done the hard work for us, it is still crucial to understanding how the algorithms operate behind the scene and be able to distinguish the best use case for each. Generally, machine learning algorithms are categorized into supervised learning and unsupervised learning. Below are some of the most popular algorithms:
Supervised Learning:
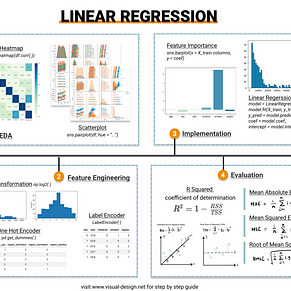
- Linear Regression
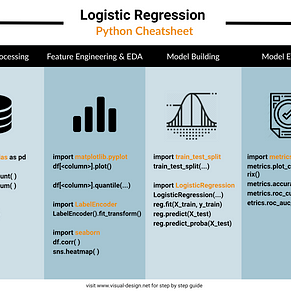
- Logistic Regression
- Neural Network
- Decision Tree
- Support Vector Machine
Unsupervised Learning:
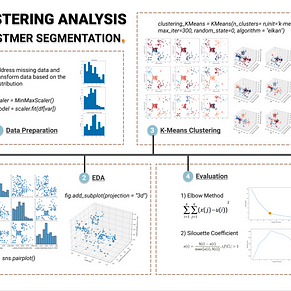
- Clustering
- PCA
- Dimension Reduction
I have created practical guides for some machine learning algorithms. If you are interested, check out my lists on these topics.
Useful Resources:
Skillset — Math
Many starters including me may have the question of why we need to learn Math in data science.
As a beginner, math knowledge mainly assists in understanding the underlying theory behind the algorithms. Moving forward, when we no longer rely on built in libraries for machine learning models, it allows us to develop and optimize customized algorithms. Additionally, hyperparameter tuning also requires advanced math knowledge for searching the best model that minimize the cost function.
This is when more complicated math topics come into place:
- calculus
- linear algebra
- optimization problem
- gradient descent
- searching algorithms
Useful Resources:
5. Model Evaluation
Skillset — Statistics (Inferential Statistics)
Inferential Statistics is particular useful when making model prediction and evaluating model performance. As opposed to descriptive statistics, inferential statistics focuses on generalizing the pattern observed in the sample data to a wider population. It provides evidence of which features have high importance in making inference. Also it determines the model performance based on evaluation metrics.
For example, for classification problem where the output are discrete categories, some common metrics are:
- Confusion matrix
- Type 1 error / Type 2 error
- Accuracy
- ROC / AUC
Whereas, for regression problem where the output are continuous numbers, some common metrics are:
- R Squared
- Root Mean Squared Error (RMSE), Mean Absolute Error (MAE), Mean Squared Error (MSE)
Useful Resources
Take-Home Message
It is a general guide that documents the learning journey I followed through, so I hope this can help some starters that are also passionate about data science and would like to invest their spare time exploring this field. Most topics I mentioned in the article are at surface level, and allows you to choose a field to dig deeper based on your own preference. If you find it helpful and would like to read more articles like this, please support by signing up Medium Membership.


No comments:
Post a Comment