Streamlit is an amazing Python library.
I daily use it to build and share interactive web applications that solve various tasks: interacting with user inputs and understanding the predictions of a machine learning model, providing an interface for visualizing and exploring data, sharing automated reports, and much more.
What makes Streamlit even more powerful is the large set of plugins (also called Streamlit components) that the open-source community develops and maintains.
In this post, I’ll be reviewing 5 Streamlit components that I often use to extend Streamlit native functionalities. We’ll understand what these libraries exactly accomplish and when you should use them.
If you’re a Streamlit user, you should definitely check this post.
Without much further ado, let’s have a look 👀
Streamlit components — what are they?
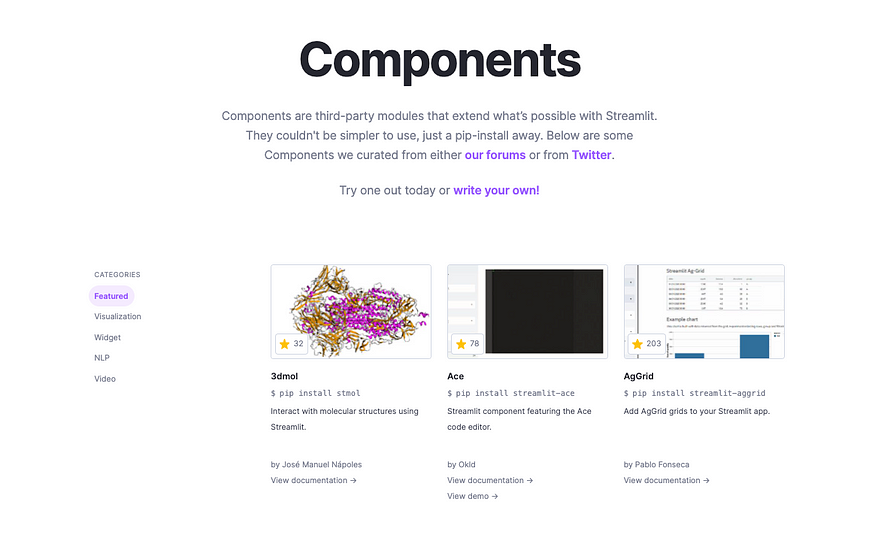
Streamlit components are external Python libraries that you install on top of Streamlit to provide additional functionalities — you can simply view them as plugins.
You can go to this link and check the most popular components that the community open-sourced.
➡️ This is beyond the scope of this post, but if you’re interested in building your own custom Streamlit component, you can watch these two video tutorials that explain the process pretty well.
Let’s now go through the list. Some of these components are not featured on the official documentation but you can still give them a try 😉.
👉 1 — streamlit_tags
Custom tag/keywords component for Streamlit
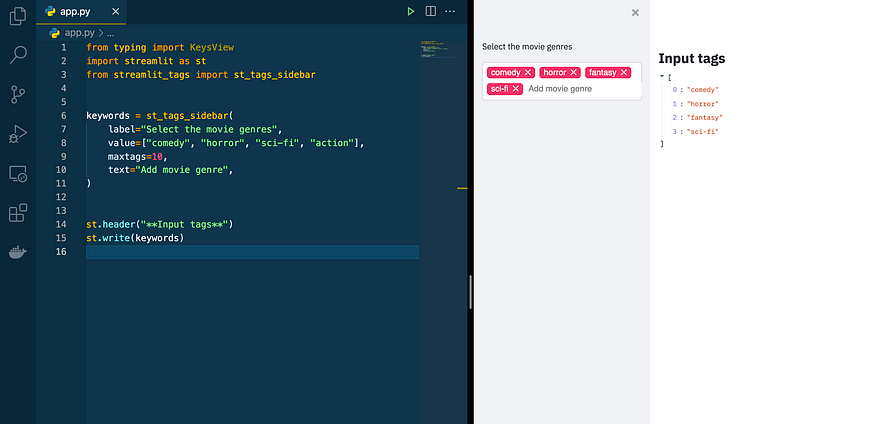
pip install streamlit-tagsStreamlit doesn’t natively allow you to input a list of words and retrieve this data as a python list in the backend. However, a common workaround exists: you get the user input through a st.text_input or st.text_area then you parse it with respect to a given separator and get a list.
But this seems like unnecessary work.
streamit_tags allows you to directly get the keywords from the interface as shown in the following example.
When would you need to use streamlit-tags?
Whenever you expect a list of words as input and don’t want to perform unnecessary error-prone string parsing.
👉 2 — streamlit_aggrid
A Streamlit wrapper around the Ag-Grid JS library
Github: https://github.com/PablocFonseca/streamlit-aggrid
pip install streamlit-aggridstreamlit_aggrid is a component that is built on top of AG Grid (a highly customizable JavaScript data grid) and it’s meant to improve Streamlit capabilities in terms of displaying dataframes and interacting with them.
Using streamlit_aggrid is as simple as importing the AgGrid function and passing a dataframe to it:
from st_aggrid import AgGridAgGrid(df)
Here are some of AgGrid features:
- Columns can be sorted, filtered and searchable:
- You can drag columns and change their order: this can be useful when analyzing data

- Large dataframes can be paginated
- You can pin columns, group them and compute aggregations — directly from the browser

- You can make your dataframes interact with the rest of the Streamlit widgets (by selecting a row for example)

These GIFs have been taken from one of my previous posts. If you’re interested in learning more about streamit_aggrid, you can check it out.
When would you need to use streamlit-aggrid?
Styling and layout put apart, I think the most interesting feature of streamlit_aggrid is the ability to make dataframes interact with the other components of the Streamlit application.
👉 3 — streamlit-echarts
A Streamlit component to render ECharts plots.
Github: https://github.com/andfanilo/streamlit-echarts
pip install streamlit-echartsYou’ve probably used Matplotlib, Bokeh, or Plotly when you had to make data visualizations in Streamlit: these are the most popular choices.
Another option I recently came across is Echarts: an amazing interactive charting and data visualization library. It’s written in JavaScript and is maintained by the Apache foundation.
Echarts provides powerful visualization capabilities with endless customization. You can use it to draw lines, bar charts, pie charts, scatter plots, geographical heatmaps, radar plots, directed graphs, treemaps, Sankey graphs, gauges, parallel plots, and many other crazy things.
The syntax is also quite simple to understand and adapt.
If you’re curious, you can check what you can do with echarts here.

streamlit-echarts is the component you’ll need to integrate Echarts plots in your Streamlit apps.
I’ve played a bit with this component and I must say that it’s quite easy to use.
Let me show you an example.
Imagine that you want to embed a gauge, like the following one (code available here from the official examples)
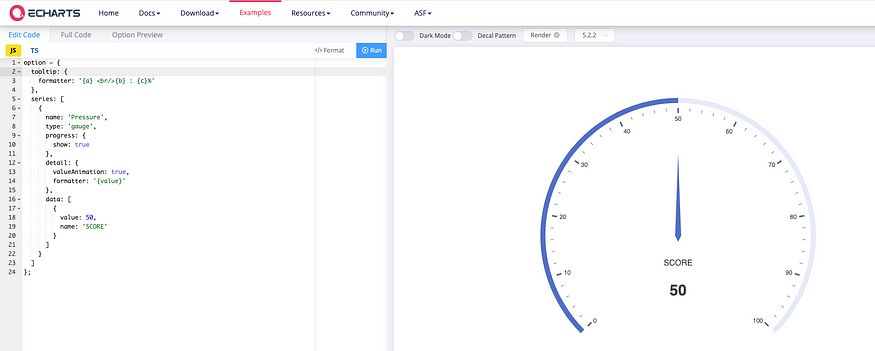
All you have to do is convert the following JSON object (from the left pane):
to a Python dictionary:
Then, you’ll have to pass this dictionary to st_echarts
from streamlit_echarts import st_echarts
st_echarts(options=options, width="100%", key=0)
And the result looks quite good on Streamlit.

When would you need to use streamlit-echarts?
- This is a very nice alternative to Plotly — I personally prefer the Echarts layout
- If you have some JS knowledge, you can build very sophisticated plots and customized layouts
👉 4 — streamlit-pandas-profiling
pandas-profiling into your Streamlit app — with a one line of code
pip install streamlit-pandas-profilingpandas-profiling has been around for a few years now. It’s a Python library that allows you to build HTML reports from your Pandas Dataframes objects. It’s very useful because it automates a lot of tasks we repeatedly perform to analyze data, compute statistical metrics, create plots, spot correlations, anomalies, or missing data.
Integrating pandas-profiling inside Streamlit is actually not a bad idea at all. I found myself many times creating exploratory data analysis (EDA) dashboards from scratch in Streamlit and this component would have saved a lot of time.
The integration between these two libraries is very smooth as shown in the animated GIF below:

When would you need to use streamlit-pandas-profiling?
If you’re building a Streamlit application that performs exploratory data analysis, streamlit-pandas-profiling is a component that may automate this task or at least speed it up a lot.
👉 5 — st-annotated-text
A Streamlit component to display annotated text
pip install st-annotated-textst-annotated-text is an interesting component that allows you to highlight specific portions of a text, and attribute a label and a color to it. If you work on NLP tasks such as Named Entity Recognition (NER) or POS tagging, this package comes in handy.

When would you need to use st-annotated-text?
Let me answer that with an example: below is a screenshot of a Streamlit app I made in the past to anonymize personal data. When a user inputs some text, a NER model recognizes named entities such as persons and locations. These entities and then annotated with a specific color and label and finally hashed to produce an anonymized text.
st-annotated-text provides useful visual information in this context by annotating each entity.
If you’re interested in learning more about this app, you can check my post:
Resources
Here’s, as always, a list of resources to go further and learn more about Streamlit and Streamlit components.
- Official documentation: https://streamlit.io/components
- https://medium.com/ssense-tech/streamlit-tips-tricks-and-hacks-for-data-scientists-d928414e0c16
- https://towardsdatascience.com/7-reasons-why-you-should-use-the-streamlit-aggrid-component-2d9a2b6e32f0
- https://towardsdatascience.com/how-to-build-and-deploy-a-text-anonymizer-with-spacy-and-streamlit-70ed9607823
- https://www.youtube.com/watch?v=BuD3gILJW-Q&ab_channel=Streamli
- https://www.youtube.com/watch?v=QjccJl_7Jco&ab_channel=Streamlit
Thanks for reading 🙏
Again, if you’ve made it this far, I would like to thank you for your time and hope that you found at least one of these Streamlit components useful.
That’s all for me today. Until next time! 👋


No comments:
Post a Comment