What is Data?
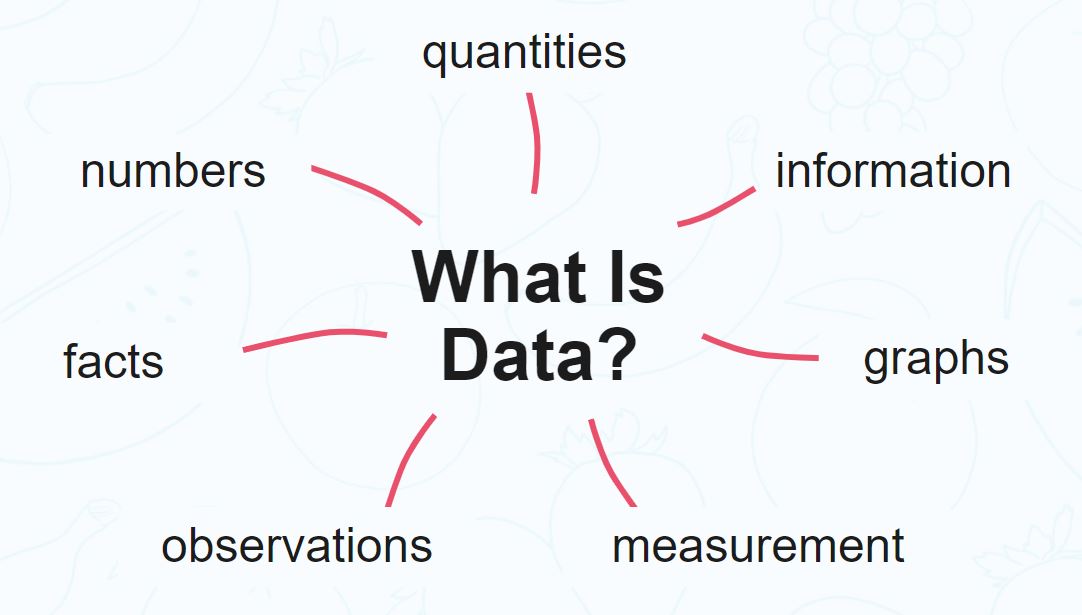
Data is the information collected through different sources which can be qualitative or quantitative in nature. Mostly, the data collected is used to analyze and draw insights on a particular topic.
For example:
1. Cylinder size, mileage, color, etc. for the sale of a car
2.If the cells in the body are malignant or benign to detect Cancer
Types of Data
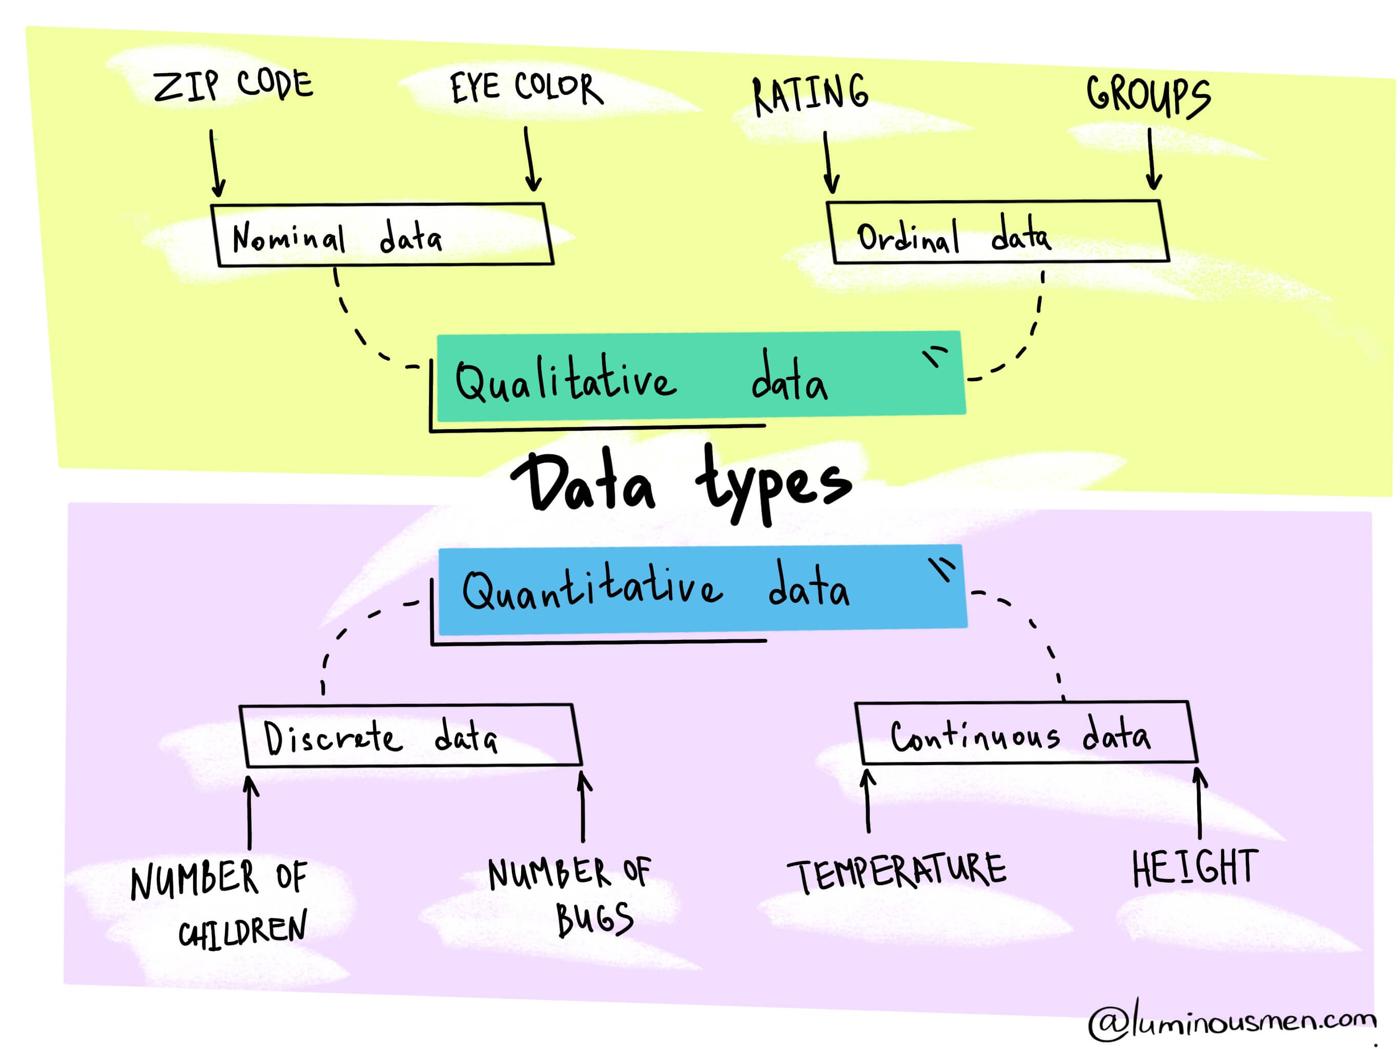
Numerical Data
Numerical data is the information in numbers i.e. numeric which poses as a quantitative measurement of things.
For example:
- Heights and weights of people
- Stock Prices
a) Discrete Data
Discrete data is the information that often counts of some event i.e. can only take specific values. These are often integer-based, but not necessarily.
For example:
- Number of times a coin was flipped
- Shoe sizes of people
b) Continuous Data
Continuous Data is the information that has the possibility of having infinite values i.e. can take any value within a range.
For example:
How many centimeters of rain fell on a given day
Categorical Data
This type of data is qualitative in nature which has no inherent mathematical significance. It is sort of a fixed value under which a unit of observation is assigned or “categorized”.
For example:
- Gender
- Binary Data (Yes/No)
- Attributes of a vehicle like color, mileage, number of doors, etc.
Ordinal Data
This type of data is the combination of numerical and categorical data i.e. categorical data having some mathematical significance.
For example:
Restaurant ratings from 1-5, 1 being the lowest and 5 being the highest
STATISTICS:

Mean, Median and Mode
Mean
In mathematics and statistics, the mean is the average of the numerical observations which is equal to the sum of the observations divided by the number of observations.

where,
 | = | arithmetic mean |
 | = | number of values |
 | = | data set values |
Median
The median of the data, when arranged in ascending or descending value is the middle observation of the data i.e. the point separating the higher half to the lower half of the data.
To calculate the median:
- Arrange the data in ascending or descending order.
- an odd number of data points: the middle value is the median.
- even number of data points: the average of the two middle values is the median.

 | = | an ordered list of values in the data set |
 | = | number of values in data set |
Mode
The mode of a set of data points is the most frequently occurring value.
For example:
5,2,6,5,1,1,2,5,3,8,5,9,5 are the set of data points. Here 5 is the mode because it’s occurring most frequently.
Variance and Standard Deviation
Variance
Mathematically and statistically, variance is defined as the average of the squared differences from the mean. But for understanding, this depicts how spread out the data is in a dataset.
The steps of calculating variance using an example:
Let’s find the variance of (1,4,5,4,8)
- Find the mean of the data points i.e. (1 + 4 + 5 + 4 + 8)/5 = 4.4
- Find the differences from the mean i.e. (-3.4, -0.4, 0.6, -0.4, 3.6)
- Find the squared differences i.e. (11.56, 0.16, 0.36, 0.16, 12.96)
- Find the average of the squared differences i.e. 11.56+0.16+0.36+0.16+12.96/5=5.04
The formula for the same is:

Standard Deviation
Standard deviation measures the variation or dispersion of the data points in a dataset. It depicts the closeness of the data point to the mean and is calculated as the square root of the variance.
In data science, the standard deviation is usually used to identify the outliers in a data set. The data points which lie one standard deviation away from the mean are considered to be unusual.
The formula for standard deviation is:

 | = | population standard deviation |
 | = | the size of the population |
 | = | each value from the population |
 | = | the population mean |
Population Data V/s Sample Data
Population data refers to the complete data set whereas sample data refers to a part of the population data which is used for analysis. Sampling is done to make analysis easier.
When using sample data for analysis, the formula of variance is slightly different. If there are total n samples we divide by n-1 instead of n:
 | = | sample variance |
 | = | the value of the one observation |
 | = | the mean value of observations |
 | = | the number of observations |
PROBABILITY:
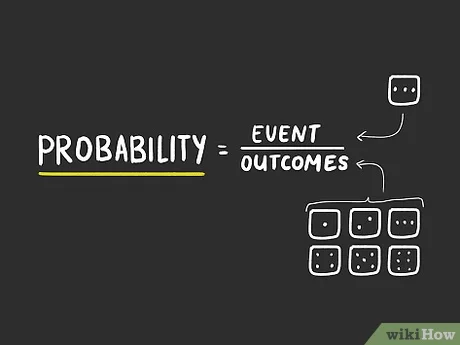
What is Probability?
The concept of probability is extremely simple. It means how likely an event is about to occur or the chance of the occurrence of an event.
The formula for probability is:
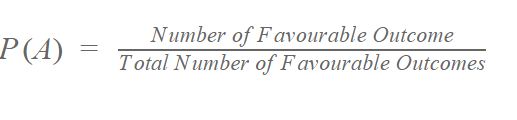
For example:
The probability of the coin showing heads when it’s flipped is 0.5.
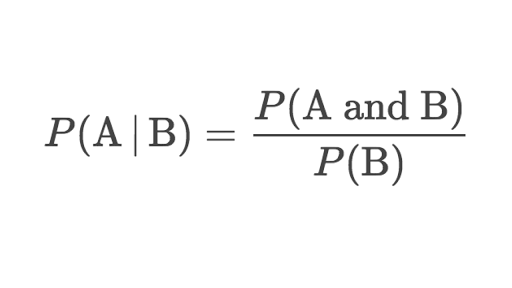
Conditional Probability
Conditional probability is the probability of an event occurring provided another event has already occurred.
The formula of conditional probability:
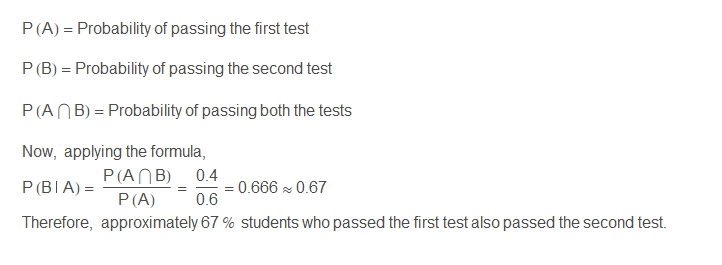
For example:
The students of a class have given two tests of the subject mathematics. In the first test, 60% of the students pass while only 40% of the students passed both the tests. What percentage of students who passed the first test, cleared the second test?
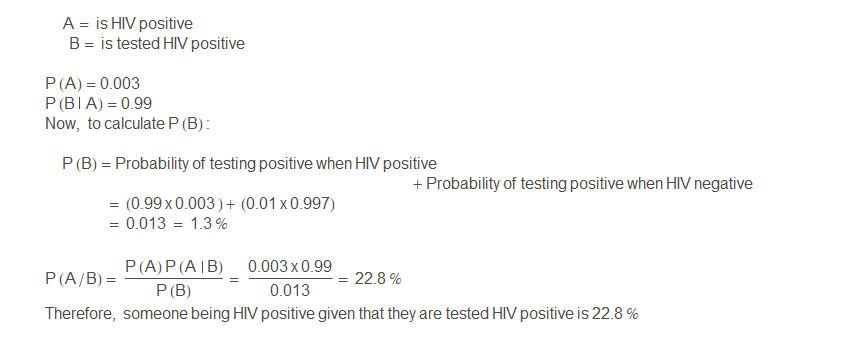
Bayes’ Theorem
Bayes’ Theorem is a very important statistical concept used in many industries such as healthcare and finance. The formula of conditional probability which we have done above has also been derived from this theorem.
It is used to calculate the probability of a hypothesis based on the probabilities of various data provided in the hypothesis.
The formula for Bayes’ theorem is:

 | = | events |
 | = | probability of A given B is true |
 | = | probability of B given A is true |
 | = | the independent probabilities of A and B |
For example:
Let’s assume there is an HIV test that can identify HIV+ positive patients accurately 99% of the time, and also accurately has a negative result for 99% of HIV negative people. Here, only 0.3% of the overall population is HIV positive.
CONCLUSION
The topics of statistics and probability covered in the article are really important but there are many other topics such as Probability Distribution Functions and their types, Covariance, and Correlation, etc. that have not been covered here because they require separate attention due to their graphical nature.
Mathematics and statistics are the heart of data science. The topics covered in this article are the basis of many algorithms, error calculating formulas, and graphical understanding of things, thus are very important and cannot be ignored.
You can also read this article on our Mobile APP


No comments:
Post a Comment