Is there anyone in the software industry who has never used or at least heard of Git?
Git is a revolutionary tool that is quite ubiquitous in software teams nowadays. This article’s purpose is not to provide an introduction to git, there are a ton of resources that can guide you through that. Its purpose is rather to analyze git relevant data in order to get important insights from those data.
Throughout this article, we are going to extract Git related data by using the Github REST API and then analyze those data by leveraging Python’s top data analysis library, Pandas as well as an interactive data visualization library that is gaining massive popularity, Plotly. We are going to take as example data the repository of Apache Spark.
Git Data Extraction
Git repositories are generally stored in source code hosting facilities. The most popular of these are Github and Bitbucket, but many others are available, like Gitea, GitLab, etc. In this article, we shall focus on Github, but the data extraction process should be similar for the other hosting facilities too.
Github provides a REST API that contains endpoints for all git related resources. In order to be able to consume Github APIs, we need to generate an access token at the Developer Settings on the Github Profile page. After having done that, we should be all set. We start our Jupyter Notebook and we begin by importing the necessary libraries:
We store in a separate file,
config.pythe configuration parameters, namely the Github username and the access token that we generated earlier. The recommended way of interacting with Github is by creating a session with the API as follows:
Which are the entities related to git that may provide valuable information on how a git repository is going?
Commits are the ones that come first into mind, but there are also others like branches, pull requests, issues, contributors list, etc. Let’s say that we need to retrieve the list of commits for a given git repository. We search the Github API documentation and find the corresponding API endpoint:
GET /repos/:owner/:repo/commits
Here we need to provide as input parameters the owner and the name of the repository. We can call the above API endpoint in Python like this:
The
commits variable contains the response returned from the Github API. Then we use the json() method of the json package for deserializing the above response object. However, this API call returns only 30 results, which corresponds to the number of results that are returned through a single Github API response by default. We can supply an extra parameter to our API request, per_page that allows us to increase the number of returned results up to 100, but the Apache Spark repository that we are trying to extract data from has roughly 26K commits!
No worries. The guys of Github have provided a pagination parameter, called
page which combined with the per_page parameter, enable us to extract all the commits of any git repository. So now, our API request should look as follows:
We can wrap up our commits extraction process in a function, that takes as parameters the owner and the repository name and returns a list of commits:
In order to control the traversing process, within each iteration, we check the
Link parameter in the headers of the response if it contains the rel="Next" attribute value, which tells us that there exists a successive page and we can continue our iteration; otherwise we stop there. In order to learn more about this approach, you can read the Traversing with Pagination guide in the Github docs.
Having extracted our commits in a list, we now can generate a Pandas Dataframe from that list of dictionaries, so we define the following function to handle that task:
The
json_normalize function does properly that, it normalizes a semi-structured JSON (a list of dictionaries) into a flat table. We now invoke the above-created function by passing the necessary parameters for the Apache Spark git repository:
The same process is performed for the extraction of other resources, so I am skipping that part and you can go through it in the Github repository of this article. I have also added the possibility of storing the results in a CSV file or an SQLAlchemy supported database so that we can access those data for later analysis.
Data Preprocessing
So we have our commits and branches and the other resources stored in memory (or in CSV files if you like). The next step is preprocessing those data.
Inspecting the structure of the commits dataframe, we get this result:

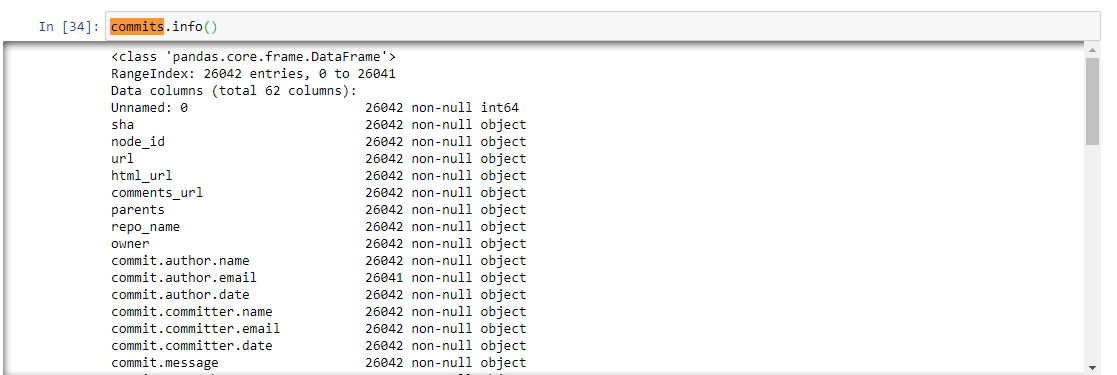
We are going to drop the majority of these columns and more importantly, we shall generate some time-related columns that are needed for our data analysis process. The following code transforms the commit date field into a datetime field and leverages the
dt accessor object for datetimelike properties of a Pandas Series:
After dropping the unnecessary columns, our
commits.head method returns:

Git Data Analysis
Now we turn to the beautiful part of the data science field — the data analysis, and data visualization. What is the total number of contributors to the Spark repository?


A nice insight would be the distribution of commits by the hour of the day. We can calculate that metric because we already have generated the hour of the day for each commit of the repository. The Pandas code would be:
Now it is time to visualize some data. The Plotly Python library (plotly.py) is an interactive, open-source plotting library that supports over 40 unique chart types covering a wide range of statistical, financial, geographic, scientific, and 3-dimensional use-cases. Being a declarative programming library, Plotly allows us to write code describing what we want to make rather than how to make it. This reduces dramatically the time spent to build a figure and makes us focus more on presenting and interpreting the results.
The standard plotly imports along with the settings to run offline are:
Returning to our interesting metric of commits by the hour of the day, the plotly code needed for generating a bar chart would be nothing more than the following:

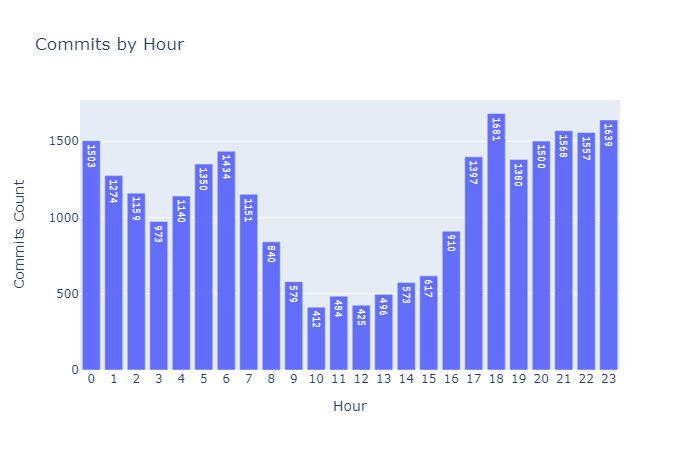
From the chart, we notice that the majority of contributions have been committed during the night :). Less activity is seen during the working hours of the day.
How is the Spark repository going over time? What has been its activity over the years? Let us create a time series chart and check it out.


It turns out that the Spark repository has seen its activity peek during 2015–2016. But can we prove that assumption? Of course, we can! We are going to calculate the daily average number of commits for each year in order to verify if 2015 and 2016 have been the most active years of the Spark repository.


The above chart shows it clearly that the repository has reached its apex in 2015 and the activity has fallen thereafter until 2017. Since that time we see a steady daily average number of commits per year and that constant trend is seen until the moment of this article’s writing.
Who are the top contributors to the Spark repository? Let’s find it out.


Being a very active repository, Spark has a lot of open pull requests too. As usual, pull requests are labeled by some predefined keywords. The following bar chart displays the number of pull requests for each label:

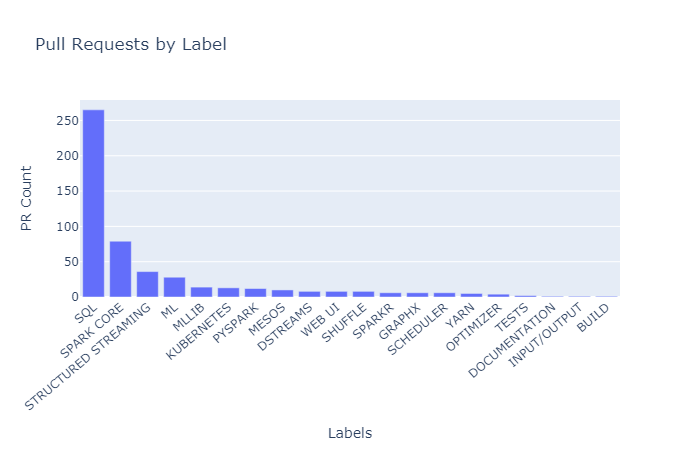
It is obvious that the most active contributors are working on SQL related functionalities. In the end, Spark is the data framework that allows SQL-like operations on multiple petabytes of data.
Congratulations
You have reached the end of this article. In this guide we went through the following important concepts:
- Extracting data in Python via Github API
- Preprocessing git data
- Performing interactive analysis and data visualization with Pandas and Plotly
Here’s the full code for everything we ran through this article:
Thanks for reading! If you want to get in touch with me, feel free to reach me on xhentilokaraj@gmail.com or my LinkedIn Profile.